
The Performance by Sub ID and Shared ID report shows you a wide range of tracking data broken down by parameters that you've appended to your tracking links. KPIs like actions, clicks, and more can all be found here.
From the top navigation bar, select Reports → More Reports.
From the Category filter next to the search bar, select Performance.
Select Performance by Sub ID and Shared ID.
You can also pin the report to the top navigation bar by hovering over the row and selecting Pin.
Below the report title, filter for the data you want to view. Select
![[Search]](https://paligoapp-cdn-eu1.s3.eu-west-1.amazonaws.com/impact/attachments/f01cdffa431a4d75ff09c130b66974d4-d9034475259004cc4d724957e37096f4.svg) [Search] when you have your filters in place.
[Search] when you have your filters in place.View the Filter reference table below for more information.
You can use the icons at the top-right of the page to
![[Email] \ [Schedule]](https://paligoapp-cdn-eu1.s3.eu-west-1.amazonaws.com/impact/attachments/f01cdffa431a4d75ff09c130b66974d4-26ab390da8d9ada8ac7a438cf0dab45a.svg) [Schedule],
[Schedule], ![[Download]](https://paligoapp-cdn-eu1.s3.eu-west-1.amazonaws.com/impact/attachments/f01cdffa431a4d75ff09c130b66974d4-3c4e4755396515995392920856bbe536.svg) [Download] in PDF, Excel, or CSV format, or
[Download] in PDF, Excel, or CSV format, or ![[Export]](https://paligoapp-cdn-eu1.s3.eu-west-1.amazonaws.com/impact/attachments/f01cdffa431a4d75ff09c130b66974d4-cb2a7e3fae274c1926f8b6d9c8835591.svg) [Export] the report via API.
[Export] the report via API.
You can view the report data as a trend graph or table and compare certain metrics.
The trend graph enables you to filter your report according to the core group of metrics that drives the highest value. This view provides the selected metric’s daily trends over a specific date range.
Select the
![[Drop-down menu]](https://paligoapp-cdn-eu1.s3.eu-west-1.amazonaws.com/impact/attachments/f01cdffa431a4d75ff09c130b66974d4-d6b35853a9aa1f1fe6bd66da29bd09fa.svg) [Drop-down menu] in the upper-right corner, then choose a specific metric.
[Drop-down menu] in the upper-right corner, then choose a specific metric.Alternate between the line, bar, and treemap views by selecting the view icon.

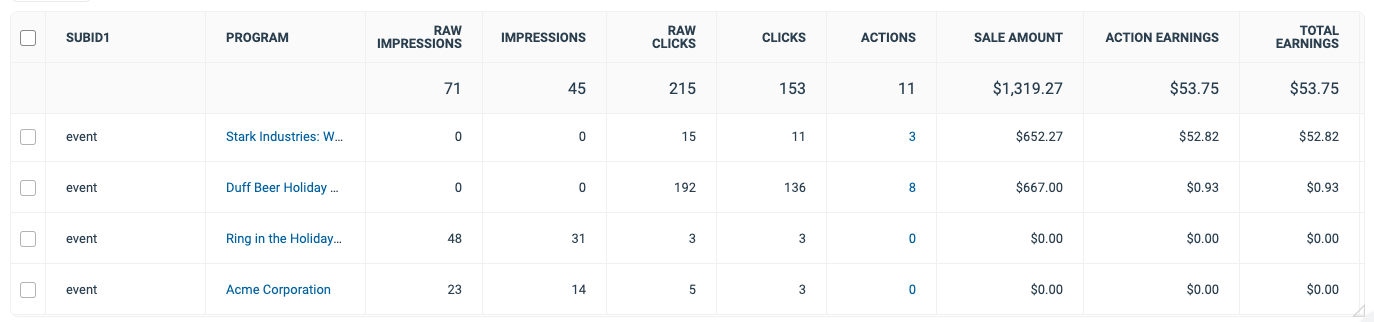
Below the trend graph is the data table. The data table provides different data points displayed in a column view. You can compare these trends provided in the detailed set of comparable numbers over the selected date range.
Refer to the Report data column reference below for more information on the columns found in the data table.
Add or remove columns from the report table using the
![[Column]](https://paligoapp-cdn-eu1.s3.eu-west-1.amazonaws.com/impact/attachments/f01cdffa431a4d75ff09c130b66974d4-63cbd5b88168715b031f0dd433962072.svg) [Columns] icon at the top-right of the report.
[Columns] icon at the top-right of the report.
The comparison graph compares the Shared IDs and Sub IDs of selected rows in the data table based on the metric selected in the trend graph. This graph will show a daily trend of the selected shared IDs and sub IDs over the selected date range.
Select the specific metric from the
[Drop-down menu] in the trend graph.Select the empty checkbox next to the row in the data table for the ads you want to compare.
Each selected checkbox will be displayed in a specific color that will reflect in the trend graph.
Select Graph rows to compare the selected rows.
Select Clear compare to clear the trend view.

Filter | Description | ||||||||||||||||||||||
|---|---|---|---|---|---|---|---|---|---|---|---|---|---|---|---|---|---|---|---|---|---|---|---|
Date Range | Filter data by when it was created. You can also compare two periods of time against each other. You can pull a maximum of 32 days of data. However, you can still perform Year-over-Year reporting by selecting | ||||||||||||||||||||||
Program | Select the specific program(s) for which you want to see performance data. | ||||||||||||||||||||||
SubId 1-3 | Filter performance data by a SubId parameter. If you want to filter according to empty sub Ids, enter Learn more about Sub IDs. | ||||||||||||||||||||||
Shared Id | Filter performance data by a Shared Id parameter. If you want to filter according to an empty shared Id, enter Learn more about Shared IDs. | ||||||||||||||||||||||
Currency | Set the currency in which you want to view report data. impact.com will convert the amounts to your selected currency. | ||||||||||||||||||||||
Add columns from a selection of data points. These data points will get added to the table after you select
| |||||||||||||||||||||||
![[Unchecked box]](https://paligoapp-cdn-eu1.s3.eu-west-1.amazonaws.com/impact/attachments/f01cdffa431a4d75ff09c130b66974d4-396370c2cdec89ba7d714c4c58e6845b.svg)
Column | Description |
|---|---|
SubId 1 | The parameter appended to your tracking URLs. |
Program | The program associated with the SubId performance data. Select the program name to see a dashboard of analytics for that program. |
Raw Impressions | The total number of times content related to the appended parameters was displayed on a user's screen. |
Impressions | The total number of times content related to the appended parameters was displayed on unique users' screens. |
Raw Clicks | The total number of clicks tracked. |
Clicks | The total number of SubId link clicks that took your audience to your partnered brand's landing page. |
Actions | The total number of conversions (sales, app installs, etc.) tracked for a particular SubId. This number excludes any reversed conversions. Select the number of actions to view an action listing for this report row over the chosen time period. |
Sale Amount | This is the total amount of revenue you have generated for your partnered brands for this SudId and Shared Id combined. |
Action Earnings | The amount of compensation you receive for driving the traffic that resulted in conversions for this SubId and Shared Id combined. |
Total Earnings | See total compensation earned for this row's SubId and Shared Id combined over the chosen time period. This is the total compensation you received from the brand for that SubId. (e.g., Action Earnings + Click Cost earnings + performance bonus). |
EPA | This metric shows you your earnings per conversion (sales, app installs, etc.) per SubId and Shared Id during the chosen period. |
EPC | View the earnings per link click (EPC) associated with a particular SubId and Shared Id combined. This amount is calculated by dividing the total action earnings by the total number of clicks. |
Conversion Rate | The number of actions divided by the total number of clicks for your SubId or Shared Id on this day. |
AOV | The average order value associated with your SubId and Shared Id. AOV=Sale Amount divided by Actions. |