
The Performance by Event Type report shows you specific data about events you want to track within your program, such as an online download or page visit.
From the top navigation bar, select Reports → More Reports.
From the Category filter next to the search bar, select Performance.
Select Performance by Event Type.
You can also pin the report to the top navigation bar by hovering over the row and selecting Pin.
Below the report title, filter for the data you want to view. Select
![[Search]](https://paligoapp-cdn-eu1.s3.eu-west-1.amazonaws.com/impact/attachments/f01cdffa431a4d75ff09c130b66974d4-d9034475259004cc4d724957e37096f4.svg) [Search] when you have your filters in place.
[Search] when you have your filters in place.View the Filter reference table below for more information.
You can use the icons at the top-right of the page to
![[Email] \ [Schedule]](https://paligoapp-cdn-eu1.s3.eu-west-1.amazonaws.com/impact/attachments/f01cdffa431a4d75ff09c130b66974d4-26ab390da8d9ada8ac7a438cf0dab45a.svg) [Schedule],
[Schedule], ![[Download]](https://paligoapp-cdn-eu1.s3.eu-west-1.amazonaws.com/impact/attachments/f01cdffa431a4d75ff09c130b66974d4-3c4e4755396515995392920856bbe536.svg) [Download] in PDF, Excel, or CSV format, or
[Download] in PDF, Excel, or CSV format, or ![[Export]](https://paligoapp-cdn-eu1.s3.eu-west-1.amazonaws.com/impact/attachments/f01cdffa431a4d75ff09c130b66974d4-cb2a7e3fae274c1926f8b6d9c8835591.svg) [Export] the report via API.
[Export] the report via API.
You can view the report data as a trend graph or table and compare certain metrics.
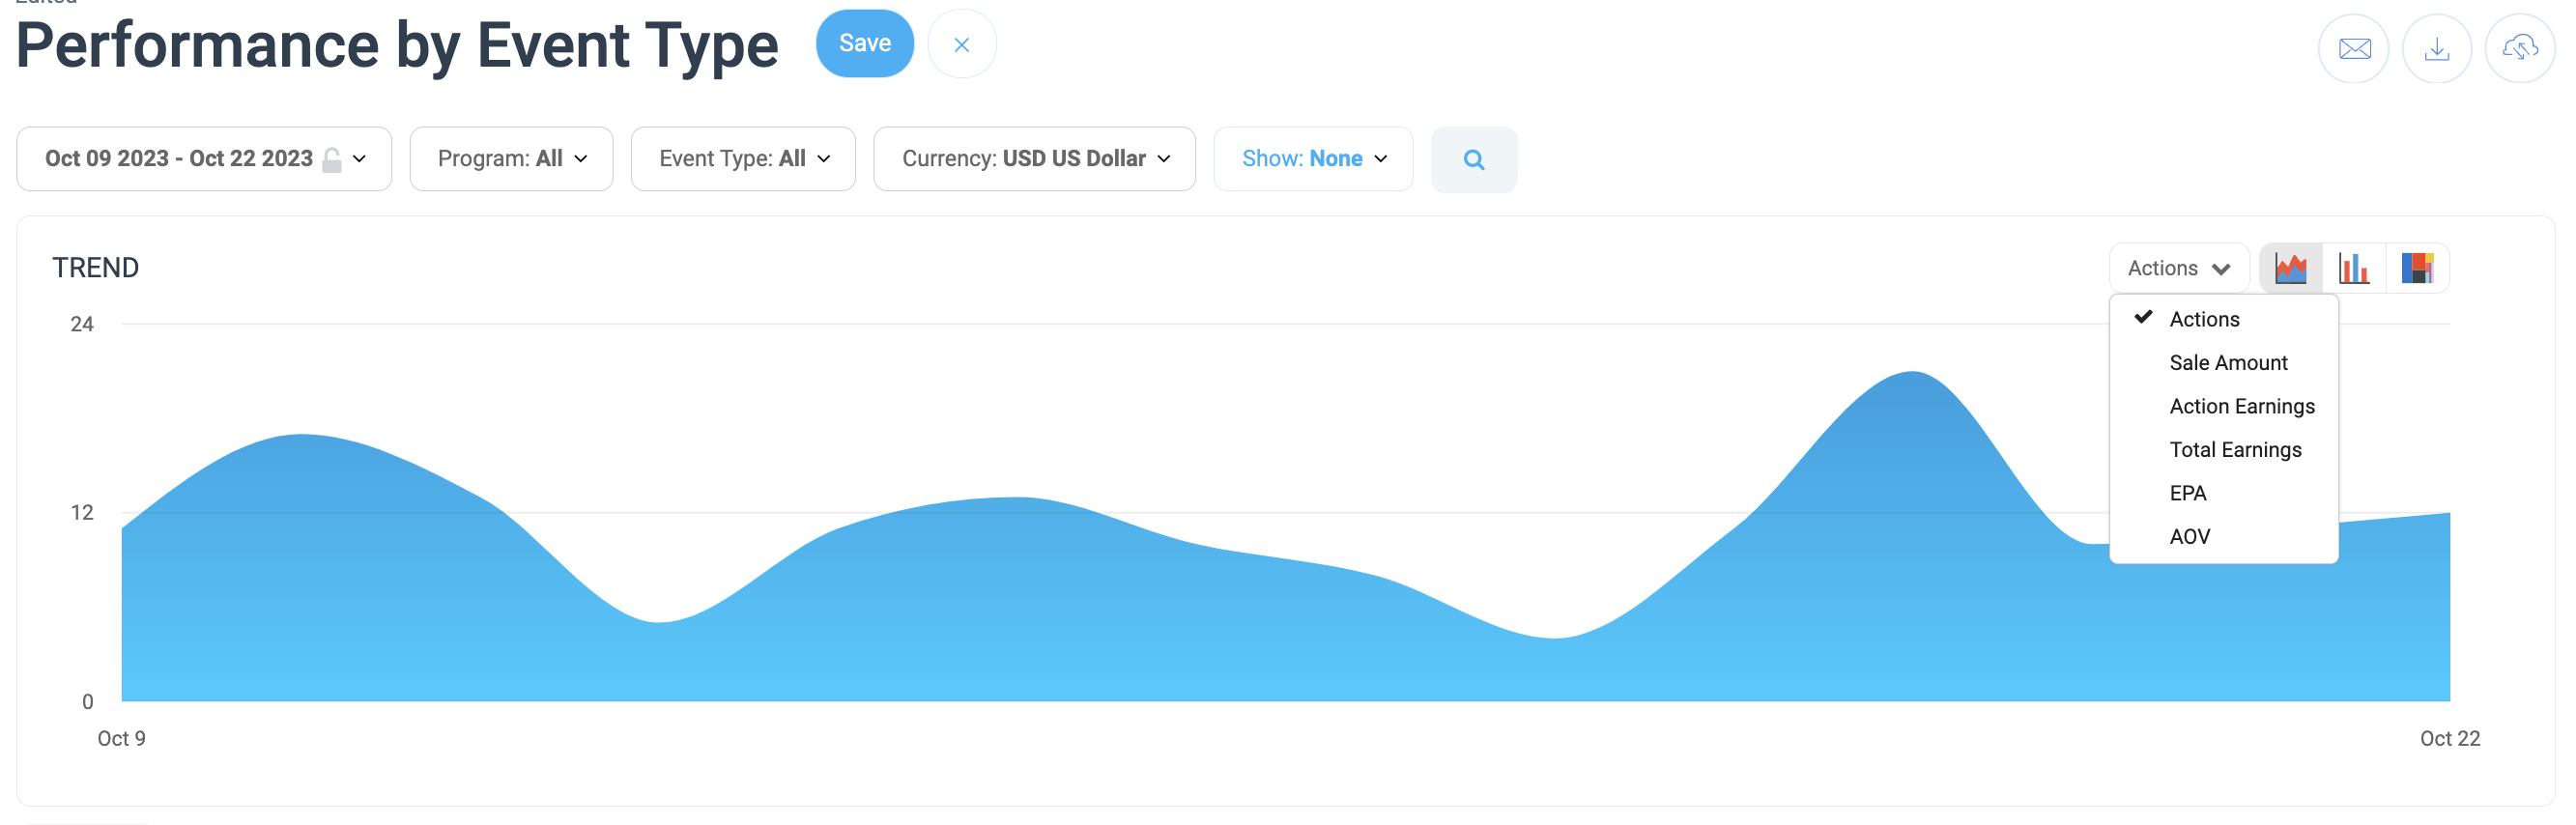
The trend graph enables you to filter your report according to the core group of metrics that drives the highest value. This view provides the selected metric’s daily trends over a specific date range.
Select the
![[Drop-down menu]](https://paligoapp-cdn-eu1.s3.eu-west-1.amazonaws.com/impact/attachments/f01cdffa431a4d75ff09c130b66974d4-d6b35853a9aa1f1fe6bd66da29bd09fa.svg) [Drop-down menu] in the upper-right corner, then, choose a specific metric.
[Drop-down menu] in the upper-right corner, then, choose a specific metric.Alternate between the line, bar, and treemap views by selecting the view icon.
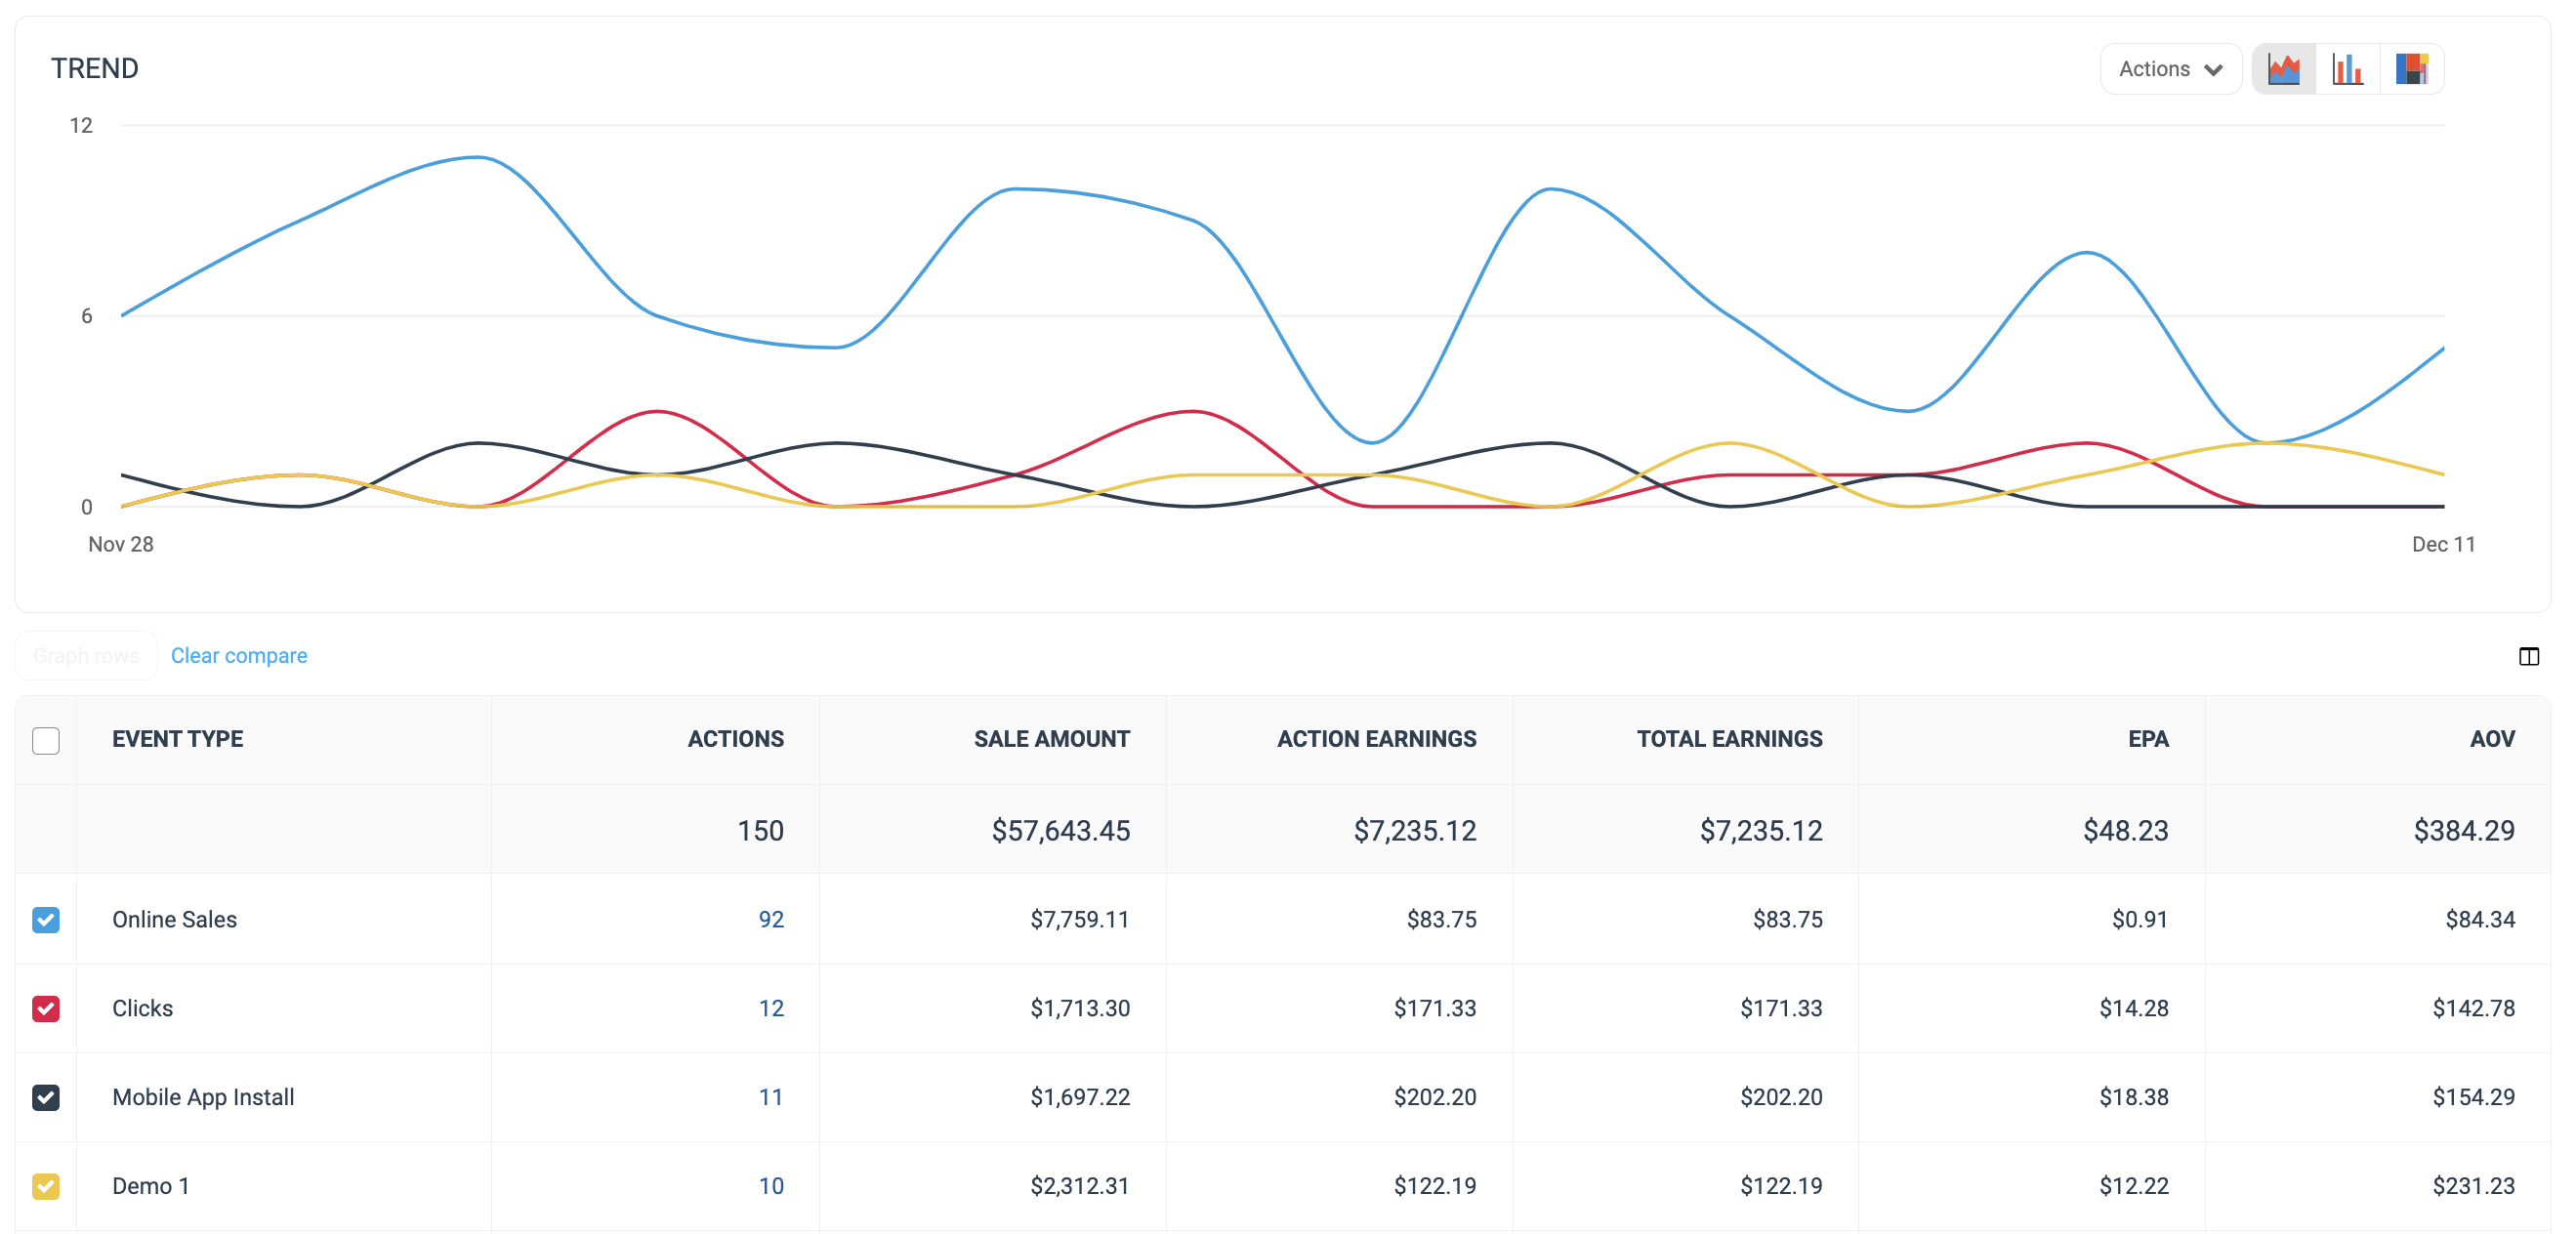
Below the trend graph is the data table. The data table provides different data points displayed in a column view. This view provides a detailed set of comparable numbers over the selected date range.
Refer to the Report data column reference below for more information on the columns found in the data table.
Add or remove columns from the report table using the
![[Column]](https://paligoapp-cdn-eu1.s3.eu-west-1.amazonaws.com/impact/attachments/f01cdffa431a4d75ff09c130b66974d4-63cbd5b88168715b031f0dd433962072.svg) [Columns] icon at the top-right of the report.
[Columns] icon at the top-right of the report.
The comparison graph compares the event types of selected rows in the data table based on the metric selected in the trend graph. This graph will show a daily trend of the selected event types over the selected date range.
Select the specific metric from the
[Drop-down] in the trend graph.Select the empty checkbox next to the row in the data table for the metrics you want to compare.
Each selected checkbox will be displayed in a specific color that will reflect in the trend graph.
Select Graph rows to compare the selected rows.
Select Clear compare to clear the trend view.
![[Unchecked box]](https://paligoapp-cdn-eu1.s3.eu-west-1.amazonaws.com/impact/attachments/f01cdffa431a4d75ff09c130b66974d4-396370c2cdec89ba7d714c4c58e6845b.svg)
Column | Description |
|---|---|
Event Type | See the specific action that was tracked. E.g., Online Sale, App Install, etc. |
Actions | The total number of conversions (sales, app installs, etc.) tracked for a particular event type. This number excludes any reversed conversions. |
Sale Amount | This is the total amount of sales you have generated for your partnered brand from link clicks. |
Action Earnings | The amount of compensation you receive for driving the traffic that resulted in conversions for the event type. |
Click Cost | The aggregated value of the amount due to you for driving clicks. |
Total Earnings | See total compensation earned per event type during the chosen months. This is the total compensation you received from the brand for that event type. (e.g., Action Earnings + Click Cost earnings + performance bonus). |
Earnings Per Action | The Earnings Per Action (EPA) metric shows you your earnings per conversion (sales, app installs, etc.), per event type, for a specific period. |
AOV | The average order value (AOV) for each event type over the chosen date range. AOV=Sale Amount divided by Actions. |