
The Product Boost: Overview by Campaign (Vendor) report helps you track the performance of the Product Boost campaigns for which you’ve approved funding. It shows key metrics such as campaign budgets, costs, boosted product sales, and the revenue generated.
From the left navigation bar, select
![[Engage]](https://paligoapp-cdn-eu1.s3.eu-west-1.amazonaws.com/impact/attachments/f01cdffa431a4d75ff09c130b66974d4-d0da6a759d66830ceb05e654496a4338.svg) [Engage] → Reports → Product Boost: Overview by Campaign (Vendor).
[Engage] → Reports → Product Boost: Overview by Campaign (Vendor).Below the report heading, filter for the data you want to view.
Use the options in the upper-right of the page to
![[Email]](https://paligoapp-cdn-eu1.s3.eu-west-1.amazonaws.com/impact/attachments/f01cdffa431a4d75ff09c130b66974d4-cca31a241674dbbd001d8c49733cc0d9.svg) [Share] the report,
[Share] the report, ![[Download]](https://paligoapp-cdn-eu1.s3.eu-west-1.amazonaws.com/impact/attachments/f01cdffa431a4d75ff09c130b66974d4-f76fdae41f0098f68cc10cdbbffa6e08.svg) [Download] it in PDF or CSV format, or apply the display currency from the the
[Download] it in PDF or CSV format, or apply the display currency from the the ![[Drop-down menu]](https://paligoapp-cdn-eu1.s3.eu-west-1.amazonaws.com/impact/attachments/f01cdffa431a4d75ff09c130b66974d4-d6b35853a9aa1f1fe6bd66da29bd09fa.svg) [Drop-down menu].
[Drop-down menu].See the references below to better understand the report.
Filter | Description |
|---|---|
Date Range | Filter data by when it was created. You can also compare two periods of time against each other. You can query a maximum of 366 days of data. However, you can still perform Year-over-Year reporting by selecting If you want to query more than 366 days of data, you will need to create multiple reports. |
Program | Select the |
Campaign | Select the |
![[Unchecked box]](https://paligoapp-cdn-eu1.s3.eu-west-1.amazonaws.com/impact/attachments/f01cdffa431a4d75ff09c130b66974d4-396370c2cdec89ba7d714c4c58e6845b.svg)
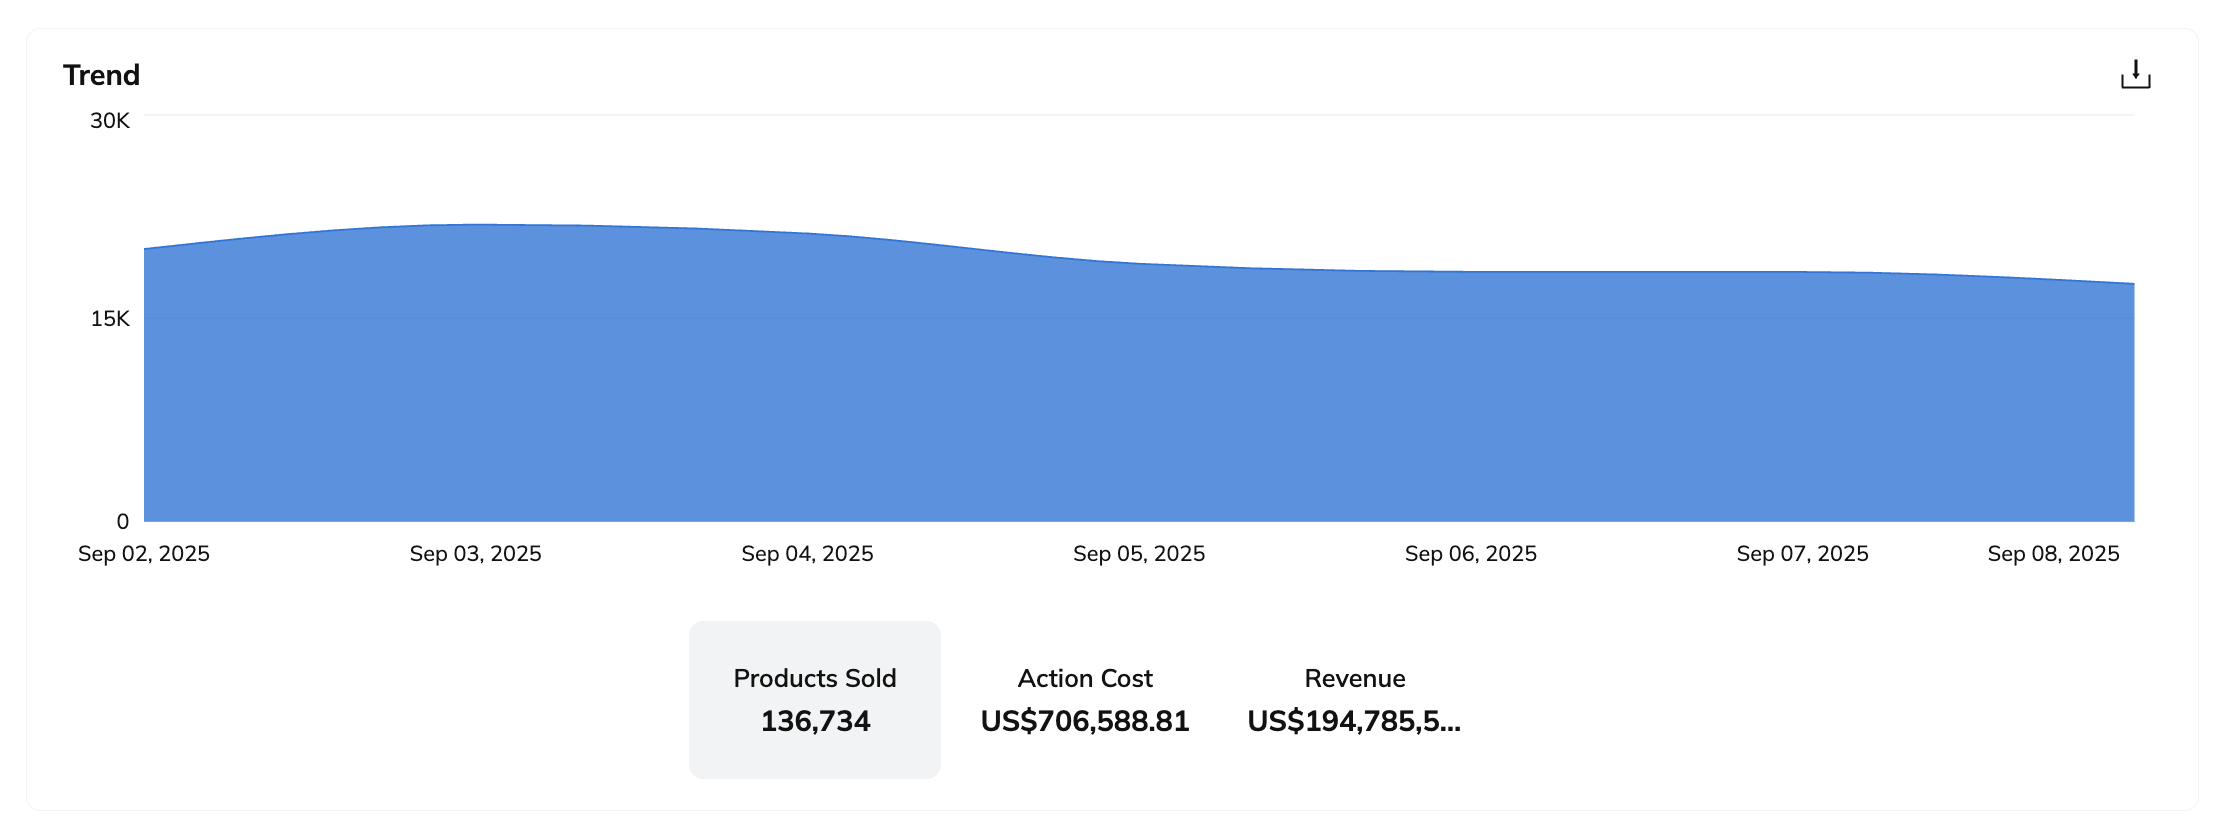
The snapshot widget lets you switch between metrics to track boosted product sales, partner payout costs, or revenue generated over time.
Hover your cursor over any point on the graph to see the exact metric value at that moment.
When you hover over the graph, you'll see an option in the top right to
[Download] the graph data in PDF or CSV format. The download file reflects the currently selected metric, i.e., Products Sold, Action Cost, or Revenue.
Column | Description |
|---|---|
Campaign | The names of the Product Boost campaigns associated with your selected program. |
Retailer | The name of the brand whose campaign you approved funding for. |
Products Sold | The number of product sales driven by the retailer’s partners in the selected Product Boost campaigns. |
Cost | The amount owed to the retailer’s partners for driving boosted product sales. |
Revenue | The total revenue value the retailer generated through product sales. |