
The Prebid Report summarizes and reports data related to prebid requests, risk assessment, GIVT, and SIVT. This article will show all of the different features associated with this report, along with a brief explanation of each section.

| Select this option to email the report (or send via FTP) to someone in .CSV, PDF, or Excel format. |
| Select this option to download the report in .CSV, PDF, or Excel format. |
| Select this option to retrieve this report via impact.com API. |


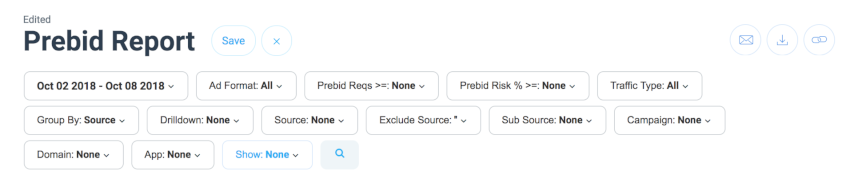
Date Range | Select the date range of the data you wish to see. Default is a 14 day range. |
Ad Format | Select which ad formats to report on: Display, Video, Other (e.g., rich media ads), N/A (no format specified). Default is All. |
Prebid Reqs >= | Select a value for prebid requests—the report will only show results greater than or equal to this value. Default is 0. |
Prebid Risk % >= | Select a value for prebid risk percentage—the report will only show results greater than or equal to this value. Default is 0, max value is 99. |
Traffic Type | Sort by different traffic type: Desktop, In-App, Mobile Web, or Other. |
Group By | Select how to group the report results from Source, App ID, Campaign, Date, Domain, None, or Sub Source. |
Drilldown | Use the drill-down filter to sort by specific details such as Browser, Browser Version, Connection, Country, Device Model, Device Vendor, ISP, OS Family, and OS Name. |
Source | Use this textbox to filter the results so that only fully-matching or partially-matching sources will appear. |
Exclude Source | Use this textbox to filter the results so that fully-matching or partially-matching sources will be excluded. |
Sub Source | Use this textbox to filter the results so that fully-matching or partially-matching sub-sources will appear. |
Campaign | Use this textbox to filter the results so that only fully-matching or partially-matching campaigns will appear. |
Domain | Use this textbox to filter the results so that only fully-matching or partially-matching domains will appear. |
App | Use this textbox to filter the results so that only fully-matching or partially-matching apps will appear. |
Show | Choose which metrics to show on the report: Prebid Risk (%), GIVT/SIVT (#), Reason Code (%) , Prebid Risk (#) , Original Names, Reason Code (#). Metrics noted with % will show overall percentages, while metrics noted with # show the numerical data of this metric. |
For reports with a trend graph view, select  [Graphs to switch between a line graph, bar graph, or square pie chart. Select the
  icon within the trend graph to change the graph metric—clicks, actions, impressions, and more.
The report data table shows relevant data based on the different filters selected and applied to the report. To view or hide columns in the report use the  [Customize] found in the upper right corner of the table. You can also click and drag individual columns left or right to make them wider or narrower.