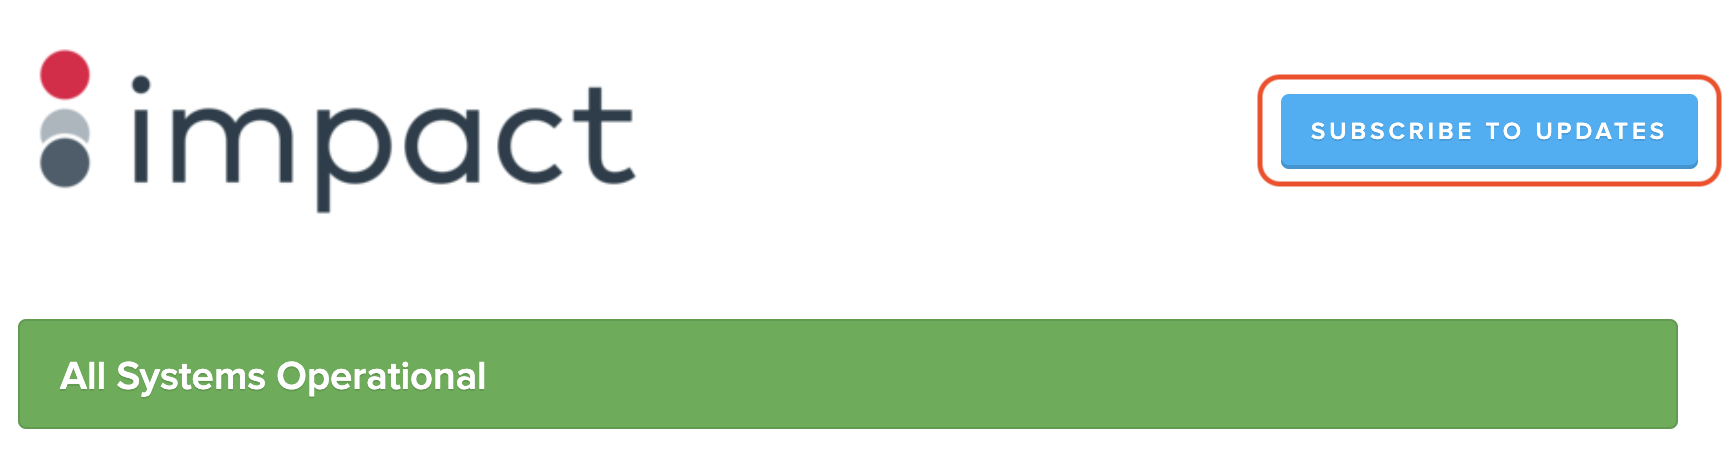
If there are any service disruptions, incident notes are updated on the impact.com status page. Subscribe to updates to stay informed about any issues affecting the performance of the impact.com platform.
Five potential statuses can be flagged across different services:
 — Operational
 — Degraded Performance
 — Partial Outage
 — Major Outage
 — Maintenance
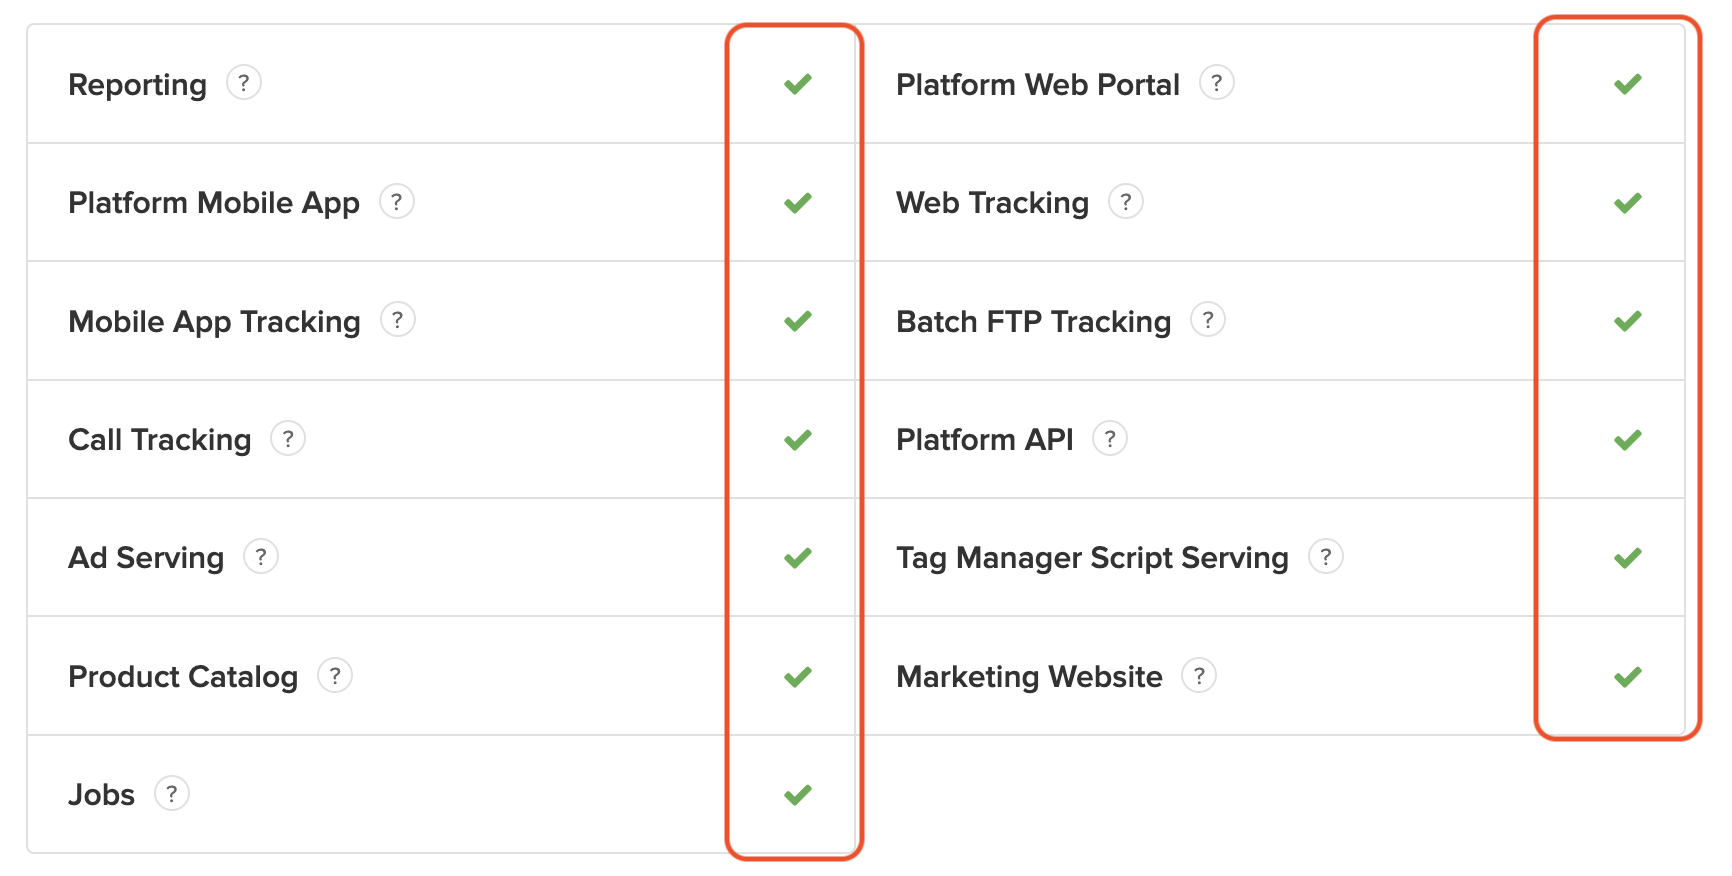
These status icons will appear next to the impact.com services listed below, to indicate which services are in what state of health.
Service | Description |
|---|---|
Reporting | The service that collates customer data for data visualizations |
Platform Mobile App | The mobile app interface for impact.com partners |
Mobile App Tracking | The system that processes clicks and conversions from mobile SDK |
Call Tracking | The system that tracks phone calls |
Ad Serving | The system that serves ads |
Product Catalog | The system that processes and delivers product catalog data |
Jobs | Job processing services for the Report Export and Click Export API requests |
The user interface for impact.com customers | |
Web Tracking | The system that tracks impressions, clicks, and conversions |
Batch FTP Tracking | The system that processes batch conversion files |
Platform API | The system that provides REST API access to the platform |
Tag Manager Script Serving | The system that serves the impact.com tag manager scripts |
impact.com's Marketing web page |
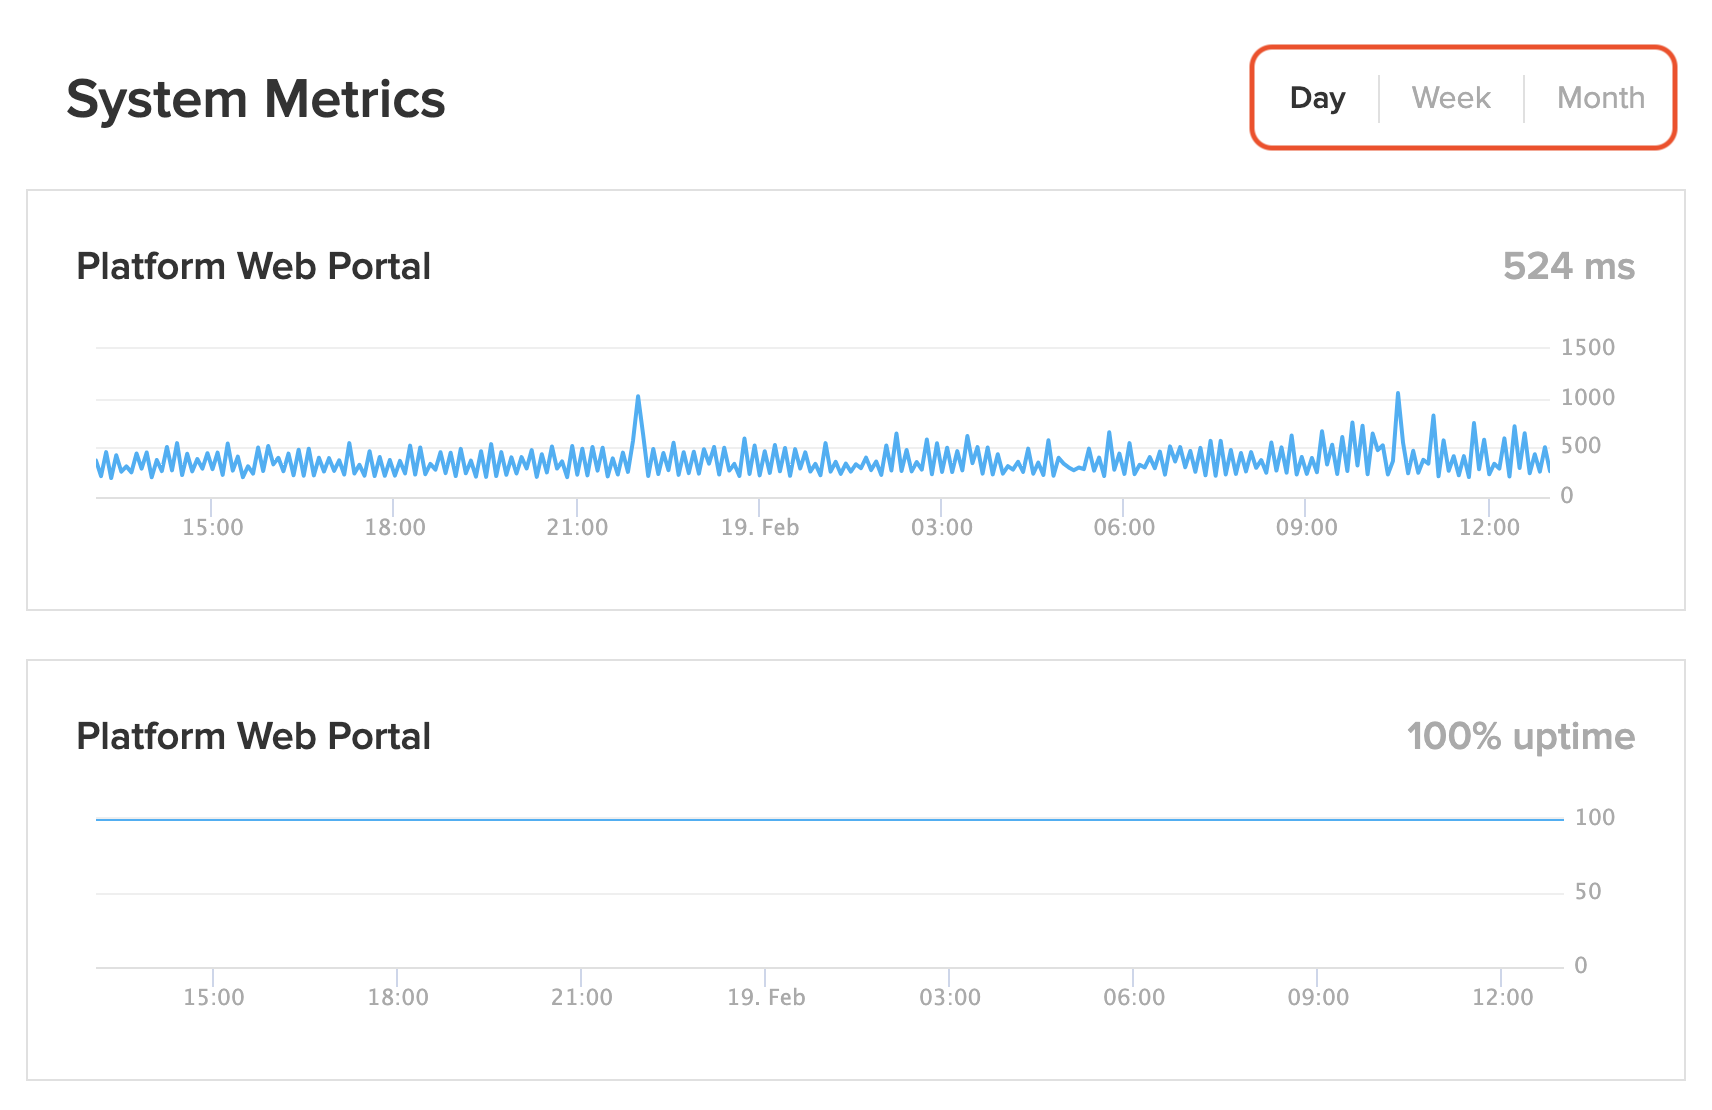
You can also view system metrics to see how it's performing. These metrics can be viewed by Day, Week, or Month for the following systems:
Platform Web portal
Shows both the response time in milliseconds as well as the uptime percentage of the impact.com app.
Web Tracking
Shows the response time in milliseconds between the web and app for impressions, clicks, and conversions.
Platform API
Shows the response time in milliseconds for REST API to access the platform.
Tracking Uptime
Shows the tracking uptime percentage over the chosen period.
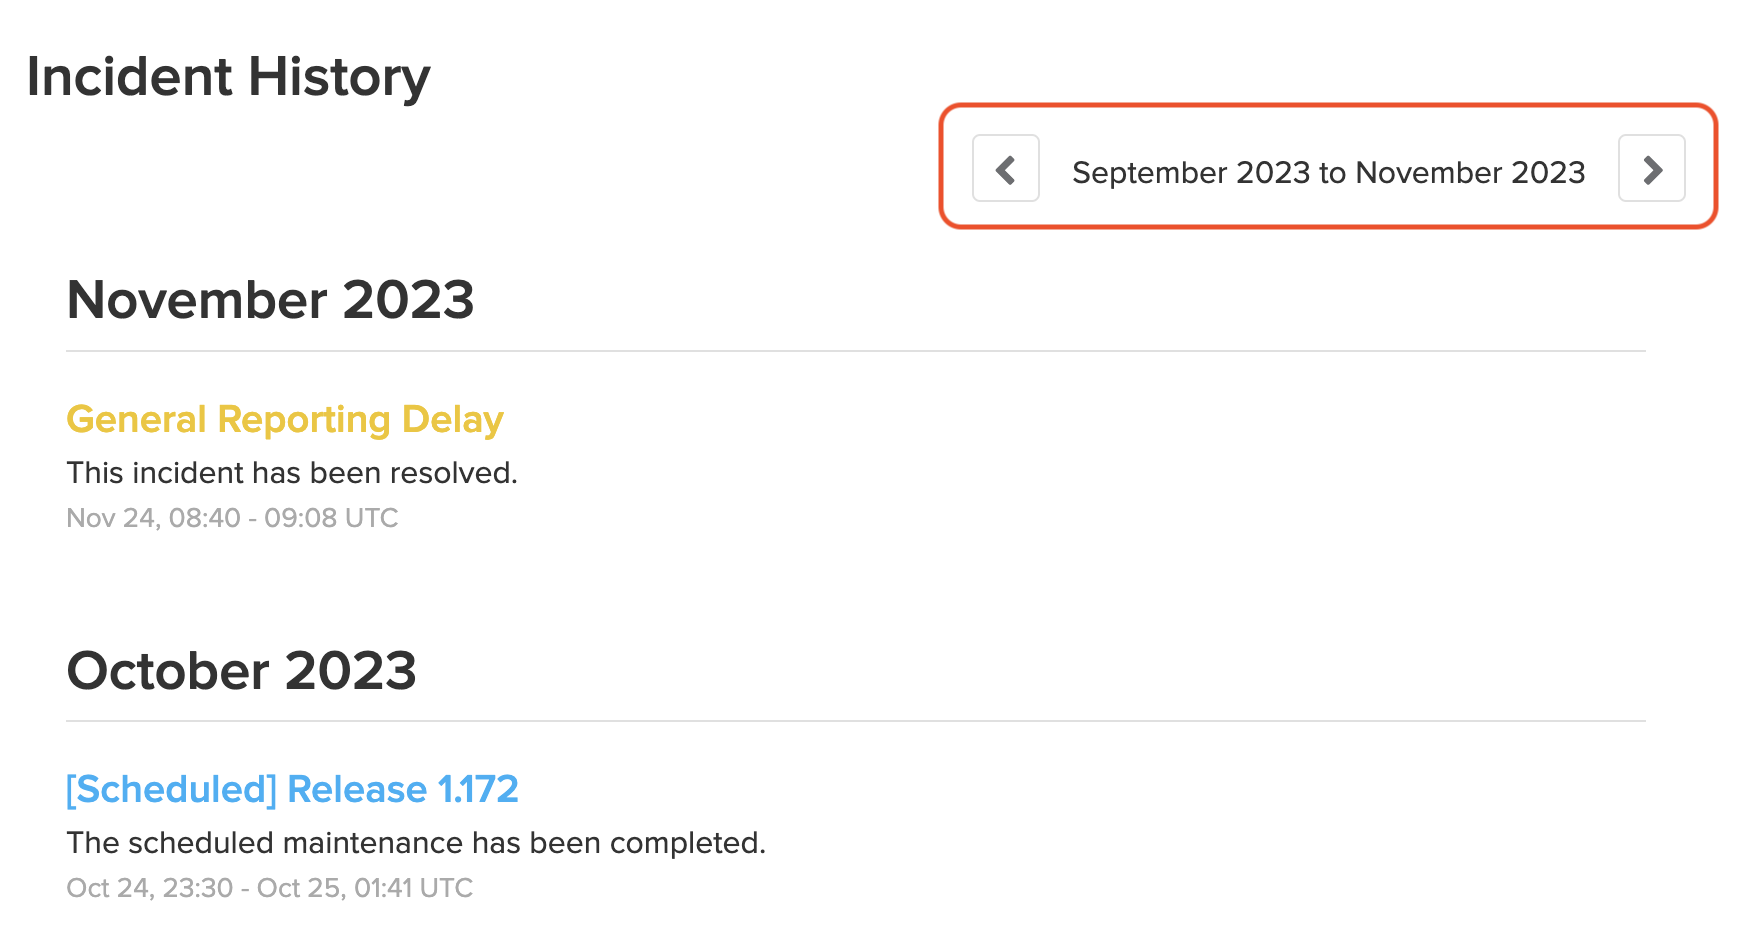
At the end of the impact.com status page you can view a log of all the past incidents that occurred. This includes maintenance updates, scheduled downtime, completed incidents, and more.
If you want to view incidents further back than one month, select ← Incident History at the bottom of the page.
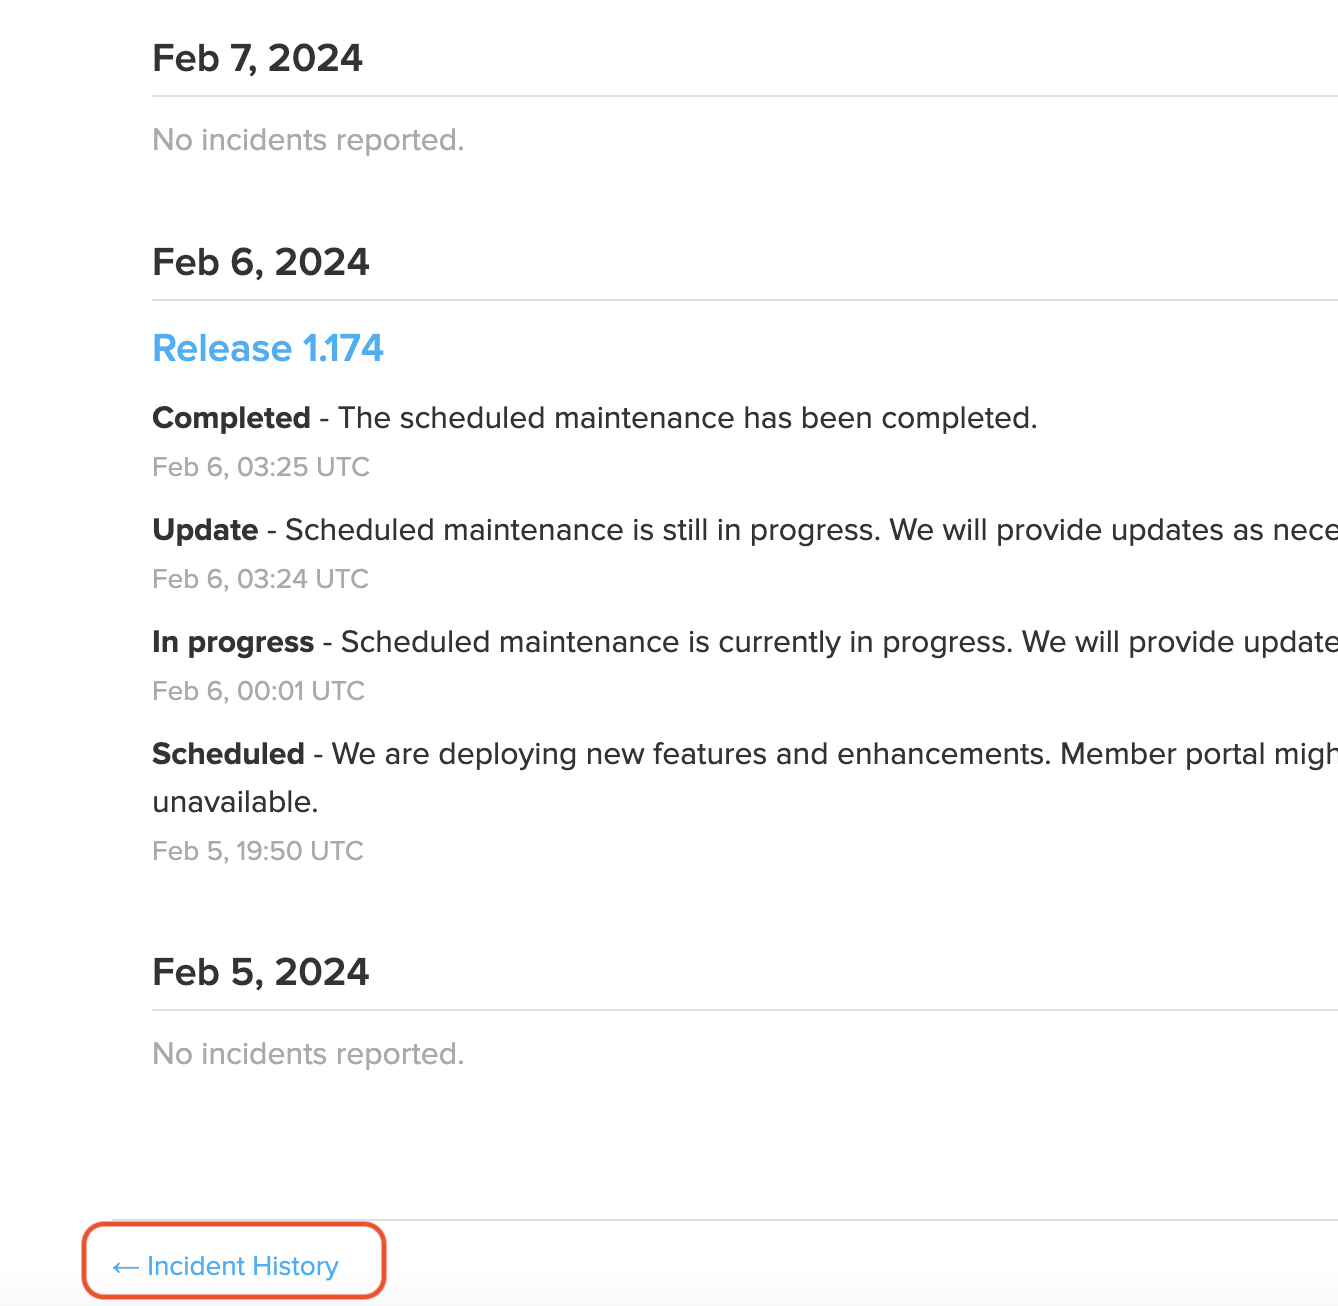
You will then be taken to the Incident History page where you can navigate back three months at a time and review any incidents reported during the selected period.