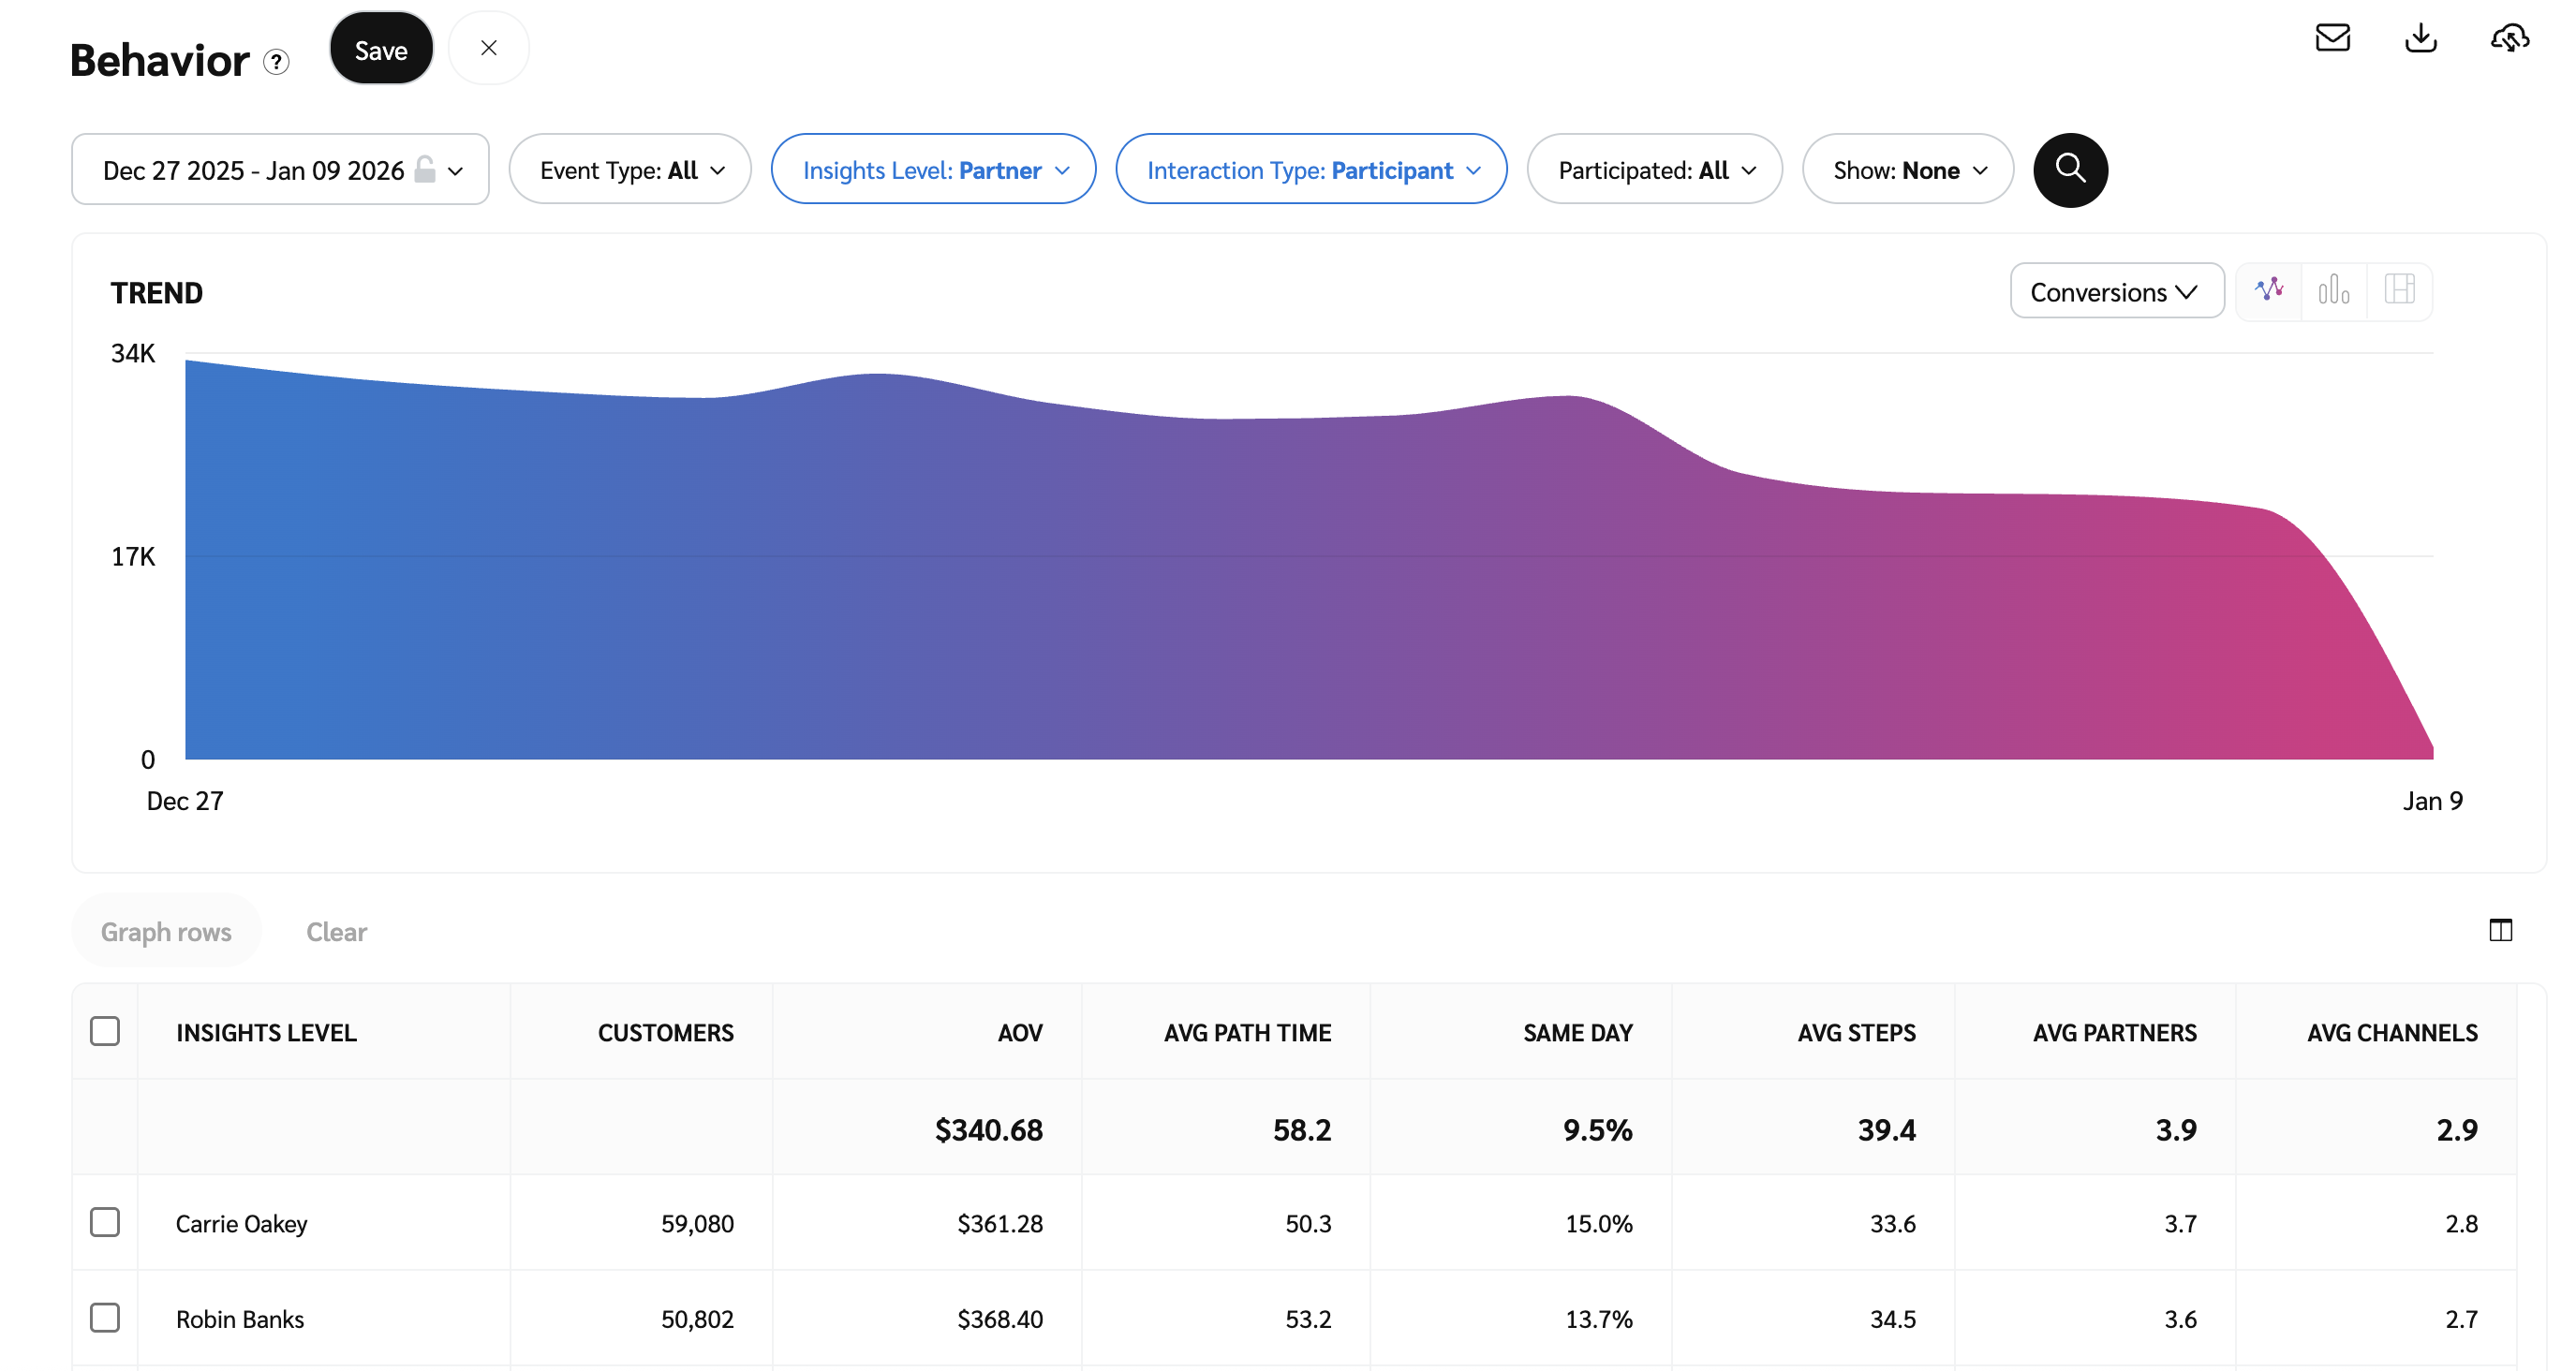
The Behavior report offers aggregate customer-level data based on an Insights Level, like your partners, by ad, and more. This report is useful for analyzing the conversion behavior of your customers. It can help identify which of your partners, ads, deals, etc. are the most successful and lead to the quickest conversions. Learn more about Optimize Essentials & Pro.
Run the behavior report
From the left navigation bar, select
[Optimize].
In the left navigation menu, select Audience → Behavior.
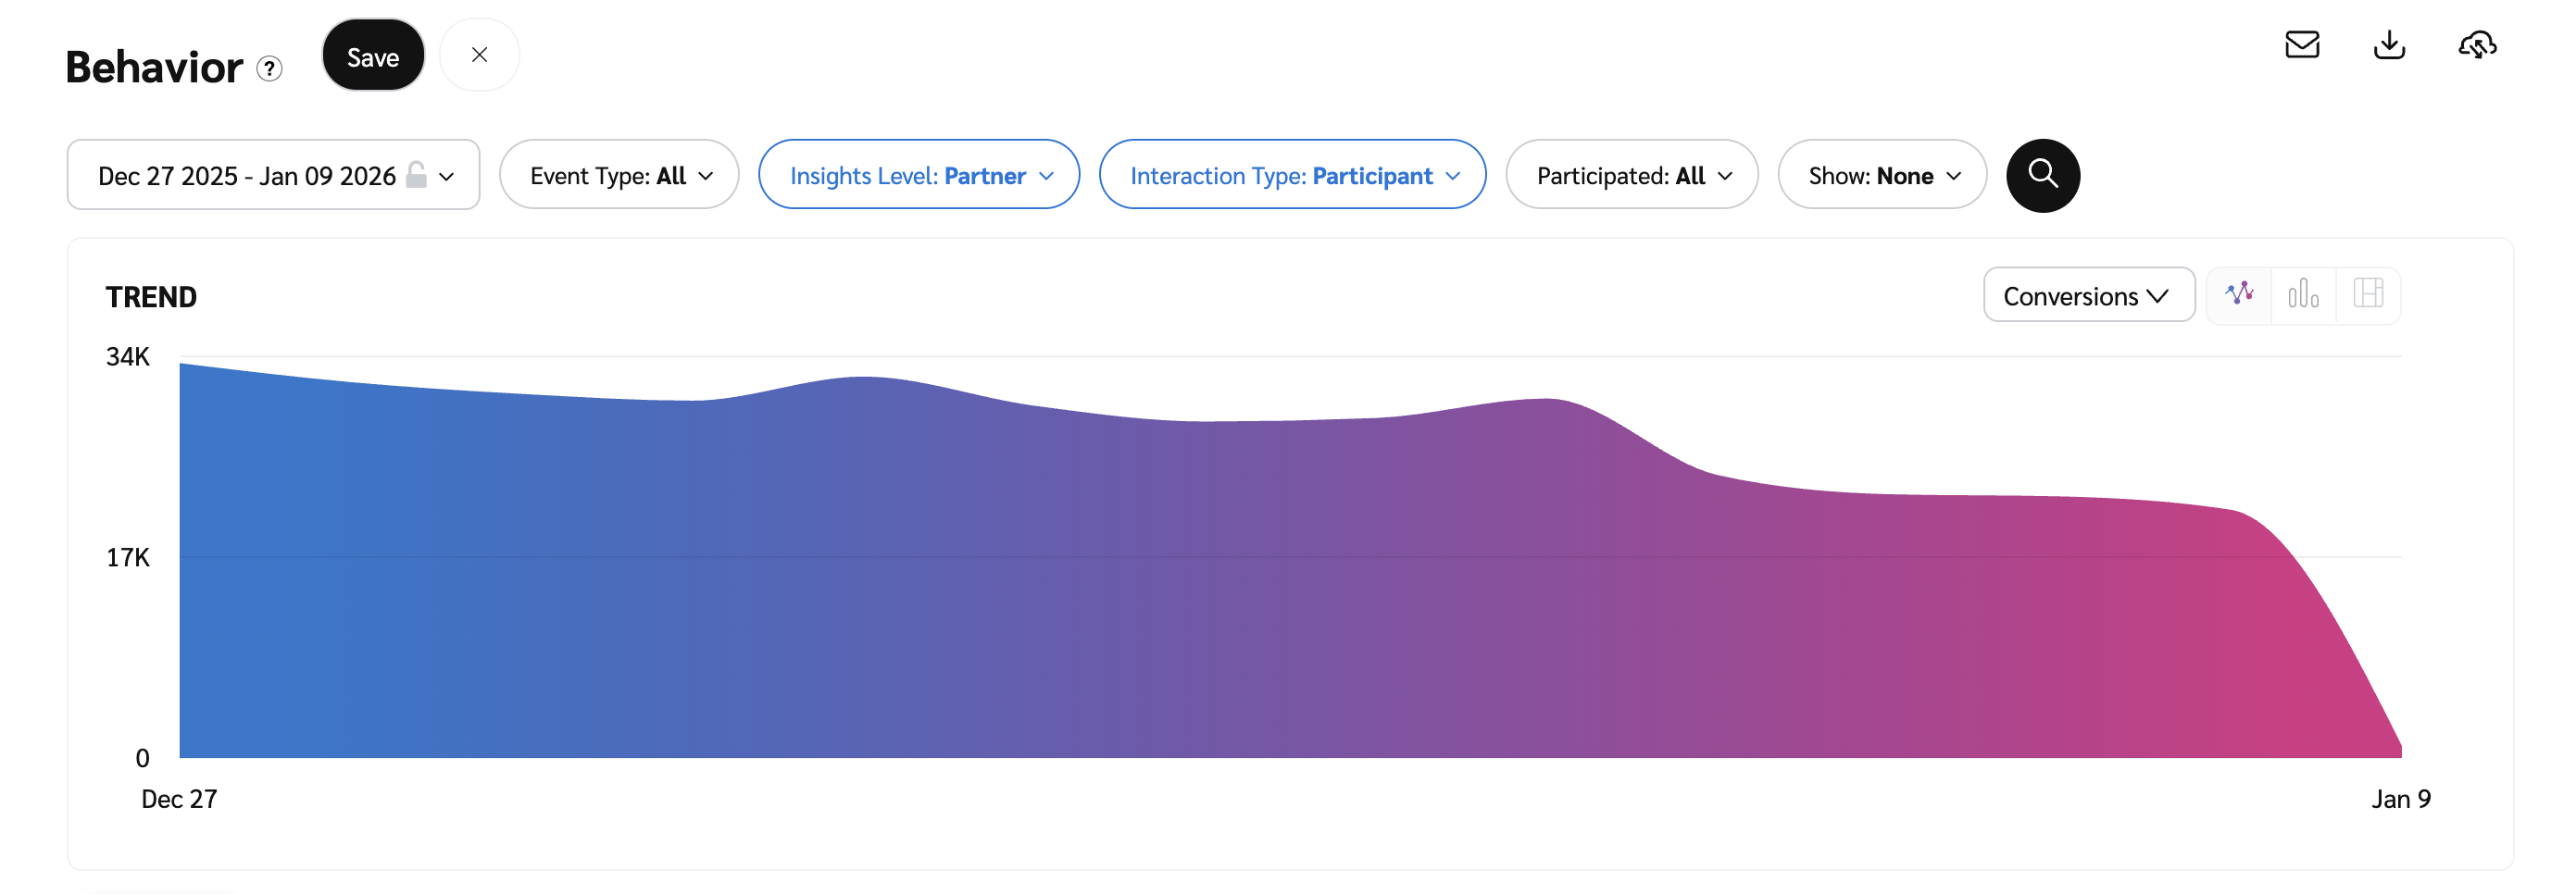
Below Behavior, you can filter for the data you want to view. Select
[Search] when you have the filters in place that you want.
View the Filter reference table below for more information.
You can use the icons at the top-right of the page to
schedule,
download (in PDF, Excel, or CSV format), or
export the report (via API).

Filter
Description
Date Range
Filter data by when it was created. You can also compare two periods of time against each other.
You can pull a maximum of 366 days of data. However, you can still perform Year-over-Year reporting by selecting compare to {Previous year}.
If you want to pull more than 366 days of data, you will need to run the report multiple times with different date ranges.
Event Type
Select the event type(s) for which you want to view data, or select All to view data for all your event types.
Insights Level
This sets the level that you want to track behavior data on:
Ad - Select this option to compare behavior data across all of your ads tracked by impact.com.
Channel - Select this option to compare behavior data across all of your channels tracked by impact.com.
Customer Status - If you're tracking customer status (e.g.,
New,Existing, etc.), you can view behavior data across different statuses.Deal - Select this option to compare behavior data across all of your deals tracked by impact.com.
Partner - Select this option compare behavior data across all of your partners on impact.com. This is the default option for this report.
Partner Groups - If you're using partner groups, select this option to compare behavior data across all of your partner groups.
Interaction Type
This sets the type of interactions you want to see behavior data for:
Closer - Select this option to see behavior data on the insights level that closed an action (i.e., last click).
Influencer - Select this option to see behavior data on the selected insight level when an influencer was part of the action lifecycle.
Introducer - Select this option to see behavior data on the selected insight level that introduced the ad to the user (i.e., first click).
Participant - Select this option to see behavior data on the selected insight level when it was a participant in the action lifecycle (i.e., it didn't introduce or close).
Solo - Select this option to see behavior data on the selected insight level when it was the only driver in the full action lifecycle.
Participated
Use the
[Drop-down menu] to select specific partners to see if they participated in the action lifecycle based on the insights level & interaction type you've selected.
Show
Show: The data point will get added to the table report under the graph after you select
[Search].
Single-Step - The number of single-step conversion paths per day for a partner.
You can view the report data as a trend graph or table and compare certain metrics.
The trend graph enables you to filter your report according to the core group of metrics that drives the highest value. This view provides the selected metric’s daily trends over a specific date range.
Select the
[Drop-down menu] in the upper-right corner, then, choose a specific metric.
Alternate between the line, bar, and treemap views by selecting the view icon.

Below the trend graph is the data table. The data table provides different data points displayed in a column view. This view provides a detailed set of comparable numbers over the selected date range.
Refer to the Report data column reference below for more information on the columns found in the data table.
Add or remove columns from the report table using the
[Columns] icon at the top-right of the report.

Column | Description |
|---|---|
Insight Levels | Displays the name of the insights level you selected before running the report. |
Customers | Displays the number of customers that this insights level has driven within the selected date range. |
AOV | Displays the associated Average Order Value for this insights level. |
Avg Path Time | Displays the calculated average path time in days that a customer takes until conversion. |
Same Day | Displays the calculated percentage of customers that convert within the same day (24 hours) for this insights level. |
Avg Steps | Displays the calculated average amount of steps (i.e., the average number of clicks) a customer takes on the conversion path for this insights level. |
Avg Partners | Displays the average number of partners included in the conversion path for this insights level. |
Avg Channels | Displays the calculated average number of channels included in the conversion path for this insights level. |
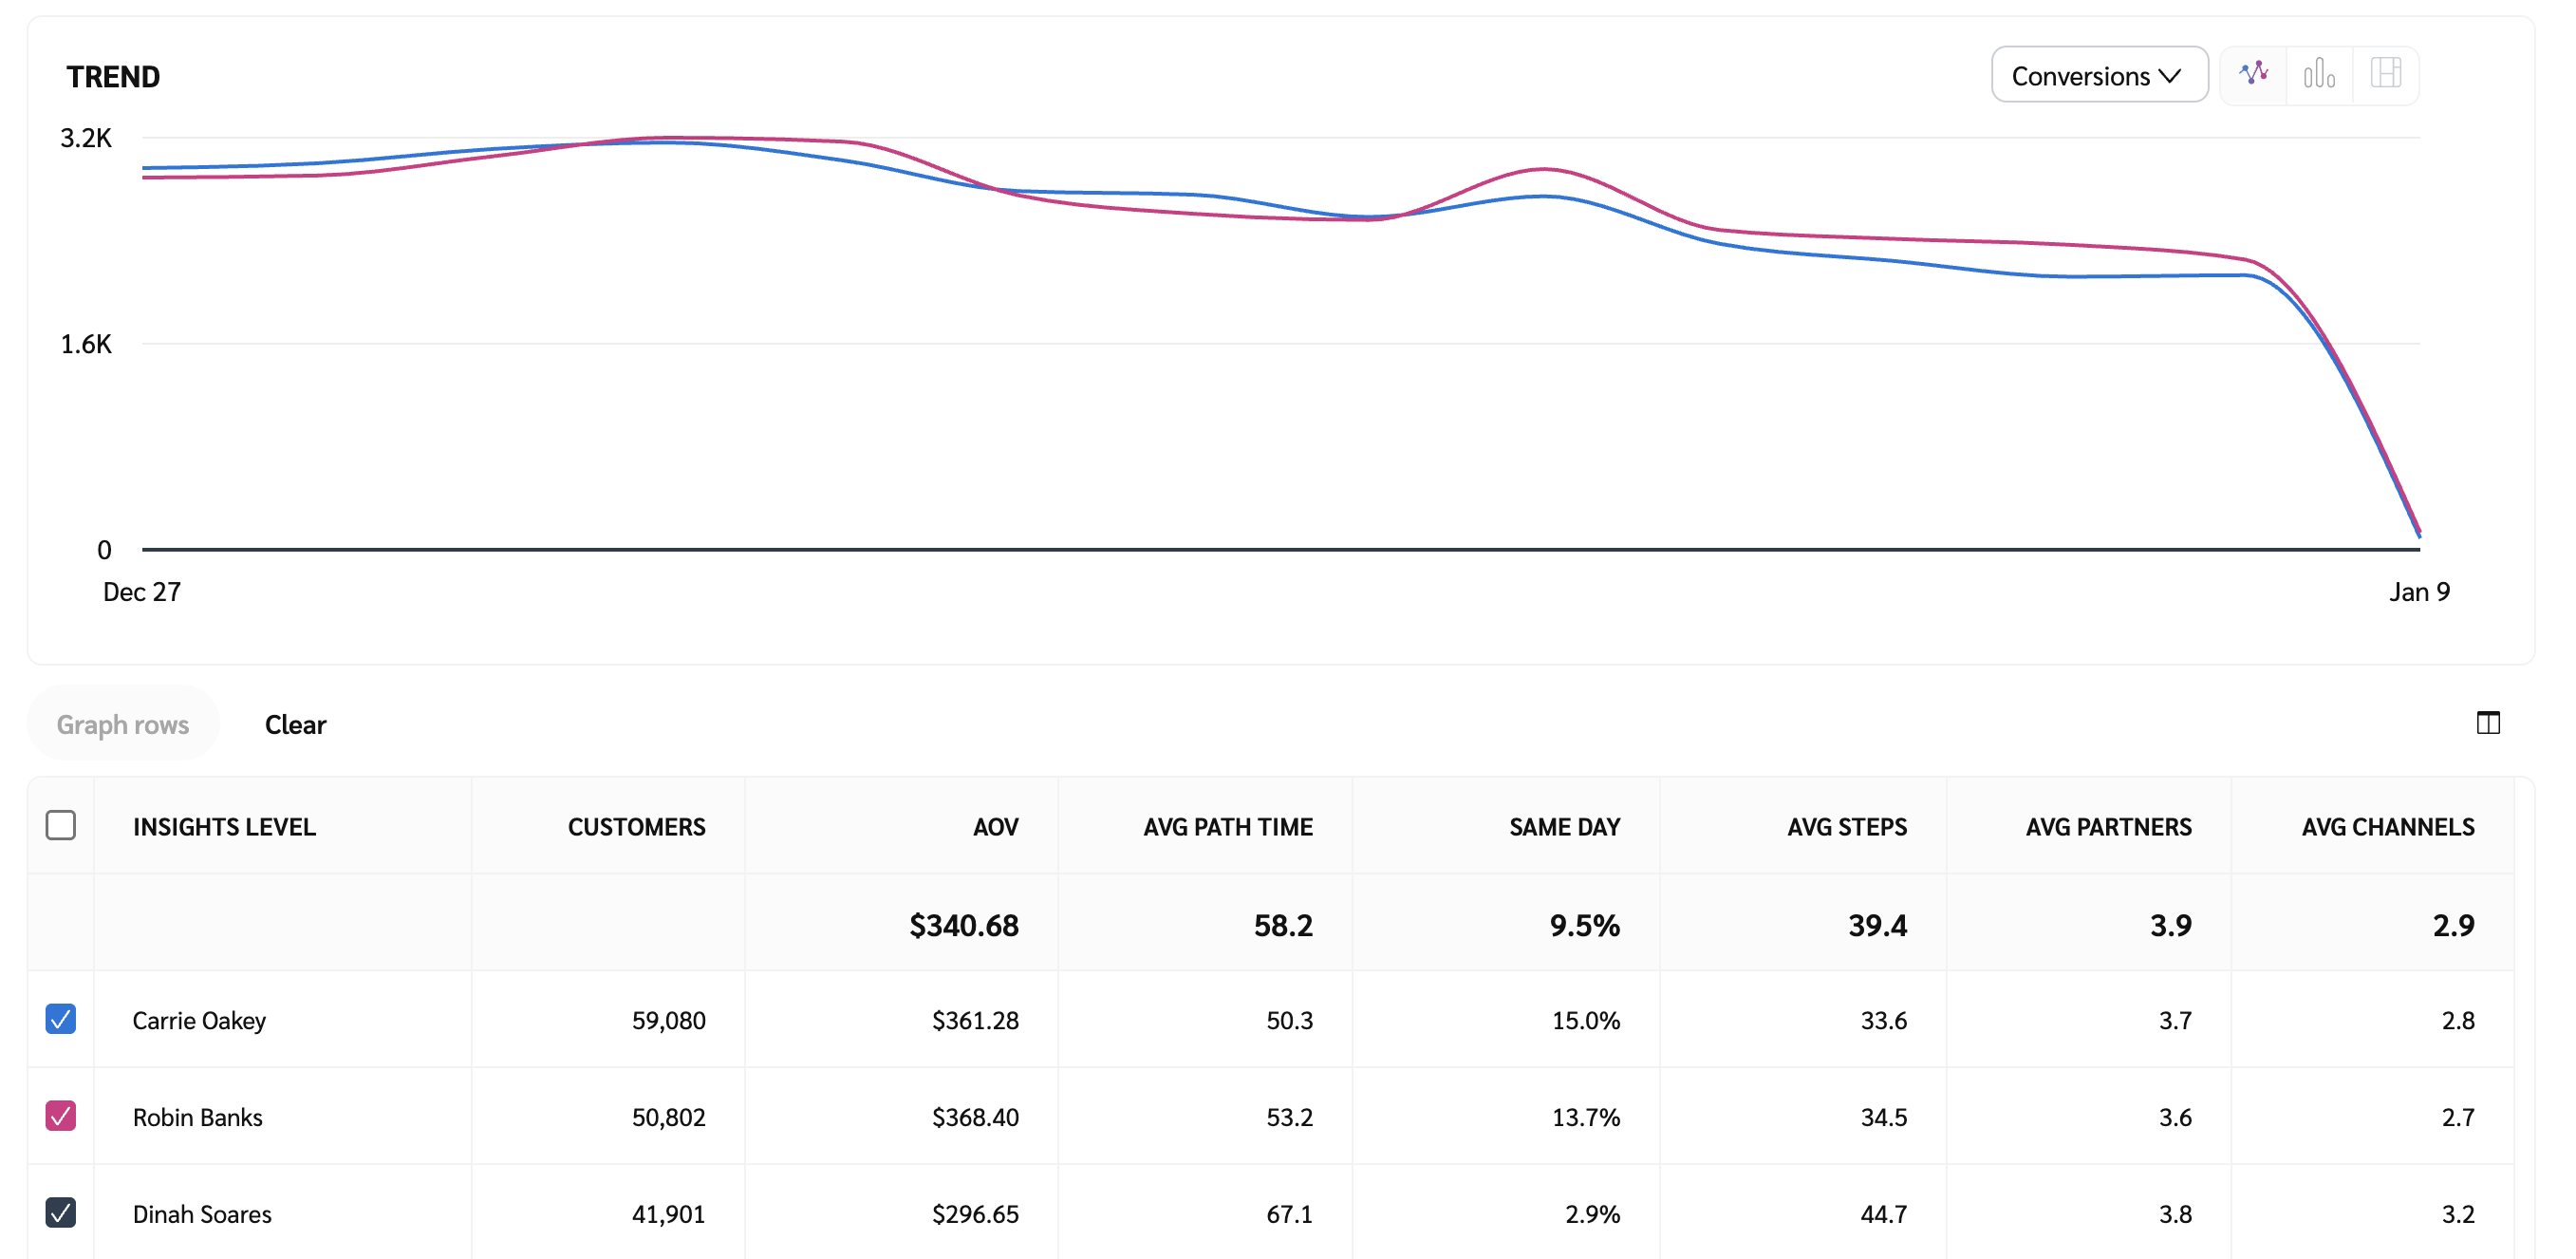
The comparison graph compares the behaviors of selected rows in the data table based on the metric selected in the trend graph. This graph will show a daily trend over the selected date range.
Select the specific metric from the
[Drop-down menu] in the trend graph.
Select the empty checkbox next to the row in the data table for the metrics you want to compare.
Each selected checkbox will be displayed in a specific color that will reflect in the trend graph.
Select Graph rows to compare the selected rows.
Select Clear compare to clear the trend view.
