The New Customer Value report supplies metrics on the aggregate value that new customers provide your program as well as their purchasing behavior. These metrics are aggregated at the partner level and can be displayed over a defined time period.
Use this report to evaluate the value brought in by a given promotion. For example, you can set the Date Range filter to Black Friday weekend, then set the Evaluation Period filter to 180 days to see how many of the new customers you acquired over that weekend ended up purchasing again within the following 180 days. Learn more about Optimize Essentials & Pro.
Access the new customer value report
From the left navigation bar, select
![[Optimize]](https://paligoapp-cdn-eu1.s3.eu-west-1.amazonaws.com/impact/attachments/f01cdffa431a4d75ff09c130b66974d4-c25216845aff9ccb7c26768fb689a623.svg) [Optimize] → Audience → Customer Value.
[Optimize] → Audience → Customer Value.
Use the filters at the top to customize the report.
Refer to the Filter reference section below for more information on these filters.
Select
![[Search]](https://paligoapp-cdn-eu1.s3.eu-west-1.amazonaws.com/impact/attachments/f01cdffa431a4d75ff09c130b66974d4-d9034475259004cc4d724957e37096f4.svg) [Search] to run the report.
[Search] to run the report.Refer to the Report data reference section below for more understanding of the data contained in the report.
Important: Your New Customer Value report won't display any data unless you pass the Customer Status and Customer ID parameters with your conversions, because impact.com requires values for both these fields before the report can populate. Reach out to support for help if you want to pass these parameters.
Filter | Description |
|---|---|
Date range | Filter data by when it was created. You can pull a maximum of 366 days of data at a time, however, you can also compare 2 periods of time against each other. To perform year-over-year reporting, select Data older than 2 years may be periodically archived. |
Insights Level | This sets the level on which you want to view new customer data:
|
Event Type | Select the event types for which you want to view data, or select All to view data for all your event types. |
Interaction Type | This sets the type of interactions for which you want to see behavior data:
|
Margin Override % | Use this filter to generate a margin that will override the Margin Per Customer column in the report. |
Evaluated Period | The number of days after a customer’s first conversion that you want the report to consider when analyzing customer value. |
Participated | Use this |
Show | Optionally, select one of these data points to include in your report.
|
![[Checked box]](https://paligoapp-cdn-eu1.s3.eu-west-1.amazonaws.com/impact/attachments/f01cdffa431a4d75ff09c130b66974d4-aee23966cd91ec2a9f9985361c43ab1a.svg)
![[Drop-down menu]](https://paligoapp-cdn-eu1.s3.eu-west-1.amazonaws.com/impact/attachments/f01cdffa431a4d75ff09c130b66974d4-d6b35853a9aa1f1fe6bd66da29bd09fa.svg)
![[Check]](https://paligoapp-cdn-eu1.s3.eu-west-1.amazonaws.com/impact/attachments/f01cdffa431a4d75ff09c130b66974d4-203223bbd82c3f8686df7b17a140ef3a.svg)
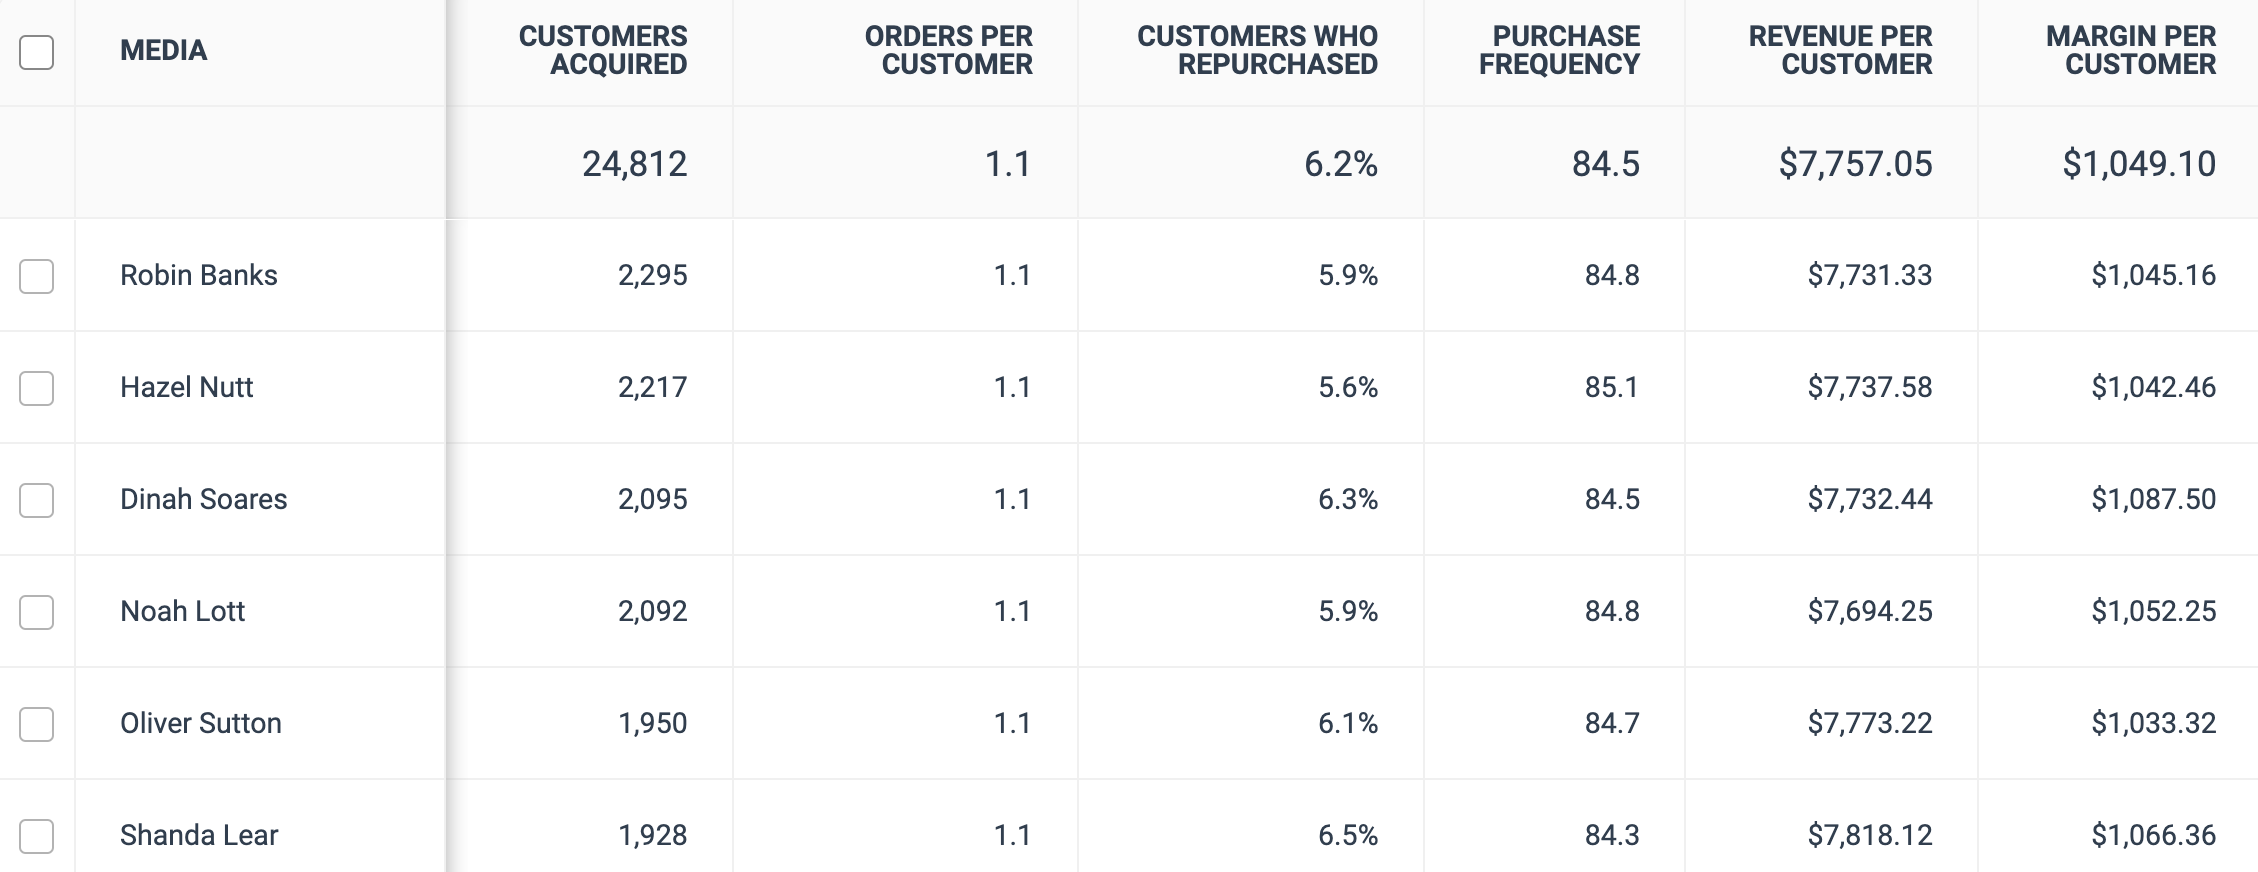
Column | Description |
|---|---|
Media | The name of the partner who acquired customers. |
Customers Acquired | A count of new customers who interacted with the partner at any point in their path to conversion during the selected date range. |
Orders Per Customer | The average number of orders made by newly-acquired customers during the evaluated period. |
Customers Who Repurchased | The percentage of newly-acquired customers who made at least two orders during the evaluated period. |
Purchase Frequency | A measure that returns the following: (Evaluated Period * Customers Acquired) / Actions In other words, the closer the purchase frequency is to the number of days in the Evaluated Period (or greater than), the better reflection this is on the partner's ability to convert customers. |
Revenue per Customer | The average generated revenue per newly-acquired customer for each partner over the evaluated period. |
Margin per Customer | The average generated margin per newly-acquired customer for each partner over the evaluated period. |
Revenue | The revenue generated by the newly-acquired customers for each partner over the evaluated period. |
Margin | The margin generated by the newly-acquired customers for each partner over the evaluated period. |
New Customer Revenue (1st Purchase) | The revenue the partner generated through first-time customers over the evaluated period. This gives you insight into which partners draw new customers and which draw repeat purchasers. |
AOV per New Customer (1st Purchase) | The Average Order Value the partner generated through first-time customers over the evaluated period. This gives you insight into which partners draw new customers and which draw repeat purchasers. |
New Customer Revenue (2nd and Subsequent Purchases) | The revenue the partner generated through non-first-time customers over evaluated period. This gives you insight into which partners draw customers who increase their expenditure after their first purchase and which draw customers who maintain their initial expenditure. |
AOV per New Customer (2nd and Subsequent Purchases) | The Average Order Value the partner generated through non-first-time customers over the evaluated period. This gives you insight into which partners draw customers who increase their expenditure after their first purchase and which draw customers who maintain their initial expenditure. |