# Performance by Ad Report

<a href="https://pxa.impact.com/student/activity/1117602?sid=0c0e3e5c-54c9-4435-9bee-ebcdccb7f292&#x26;sid_i=0?utm_source=app.impact.com&#x26;utm_medium=owned-platform&#x26;utm_content=opt-350&#x26;utm_campaign=help-center" class="button primary">Take the PXA course</a>

The *Performance by Ad* report shows you a wide range of data related to the ads promoted by your partners.

#### Manage the report

1. From the left navigation bar, select ![](https://4048883401-files.gitbook.io/~/files/v0/b/gitbook-x-prod.appspot.com/o/spaces%2FwMLlMoFBtKJa8ptd3zaw%2Fuploads%2Fgit-blob-230534471fef5f40808e921e41ee44e4a06ded03%2Fe6cb9548999afdc1ed3ce4942e4cb5b45b5cecbd323267aac2a7cd1915fccc09.svg?alt=media) **\[Engage] →** **Reports → More Reports**.
2. Under *More Reports*, select **Performance** as the filter next to the search bar.
3. Select [Performance by Ad](https://app.impact.com/secure/advertiser/engage/Adv_Performance_Report/r25/report/viewReport.report?handle=adv_performance_by_ad_pm_only).
4. Below *Performance by Ad*, you can filter for the data you want to view. Select ![](https://4048883401-files.gitbook.io/~/files/v0/b/gitbook-x-prod.appspot.com/o/spaces%2FwMLlMoFBtKJa8ptd3zaw%2Fuploads%2Fgit-blob-26956d35e17c61868ca8dba76097721fd6066ab4%2F69945c787eb2db89761c82e0cd32fb31d2fc690bfb8592d9a08b7e7983b7445b.svg?alt=media) **\[Search]** when you have the filters in place that you want.
   * View the *Filter reference* table below for more information.
   * You can use the icons at the top-right of the page to ![pin\_vnext.png](https://paligoapp-cdn-eu1.s3.eu-west-1.amazonaws.com/impact/attachments/f01cdffa431a4d75ff09c130b66974d4-aab0a3f6dfa09af685aabd8dbc9966d3.png) [**pin**](https://help.impact.com/brand/what-would-you-like-to-learn-about/platform-features/multi-program-reports/report-management/pin-a-report), ![\[Email\]](https://paligoapp-cdn-eu1.s3.eu-west-1.amazonaws.com/impact/attachments/f01cdffa431a4d75ff09c130b66974d4-cca31a241674dbbd001d8c49733cc0d9.svg) [**schedule**](https://help.impact.com/brand/what-would-you-like-to-learn-about/platform-features/multi-program-reports/data-lab-custom-reports/schedule-a-custom-report),![\[Download report\] vNext](https://paligoapp-cdn-eu1.s3.eu-west-1.amazonaws.com/impact/attachments/f01cdffa431a4d75ff09c130b66974d4-d86efd15651b5054fddb008ce5d1a1d6.svg)[**download**](https://help.impact.com/brand/what-would-you-like-to-learn-about/platform-features/multi-program-reports/report-management/download-a-report) (in PDF, Excel, or CSV format), or![\[Export report\] vNext](https://paligoapp-cdn-eu1.s3.eu-west-1.amazonaws.com/impact/attachments/f01cdffa431a4d75ff09c130b66974d4-fd77f03a4c5618018e59013607ed56bc.svg)[**export the report** ](https://integrations.impact.com/impact-brand/reference/export-reports)(via API).

#### Access the report data

You can view the report data as a trend graph or table and compare certain metrics.

{% tabs %}
{% tab title="Trend graph" %}
The trend graph enables you to filter your report according to the core group of metrics that drives the highest value. This view provides the selected metric’s daily trends over a specific date range.

1. Select the ![](https://4048883401-files.gitbook.io/~/files/v0/b/gitbook-x-prod.appspot.com/o/spaces%2FwMLlMoFBtKJa8ptd3zaw%2Fuploads%2Fgit-blob-c2cb550b55c51ea1eeff0acbd6f437a03b621a2c%2F60d033ae8a04c14498d5229c3c0160ac05feea7f605dbd770741793c900469f0.svg?alt=media) **\[Drop-down menu]** in the upper-right corner, then, choose a specific metric.
2. Alternate between the line, bar, and treemap views by selecting the view icon.

   <div data-with-frame="true"><figure><img src="https://4048883401-files.gitbook.io/~/files/v0/b/gitbook-x-prod.appspot.com/o/spaces%2FwMLlMoFBtKJa8ptd3zaw%2Fuploads%2Fgit-blob-7311e43cb46085257d71f82571b2d5e091619e25%2F20fd4d4981922d3b9cc6b6dab1ab8f0f547c9a25343901590aebaee7c0a6c8fc.png?alt=media" alt=""><figcaption></figcaption></figure></div>

{% endtab %}

{% tab title="Data table" %}
Below the trend graph is the data table. The data table provides different data points displayed in a column view. This view provides a detailed set of comparable numbers over the selected date range.

* Refer to the *Report data column reference* below for more information on the columns found in the data table.
* Add or remove columns from the report table using the ![](https://4048883401-files.gitbook.io/~/files/v0/b/gitbook-x-prod.appspot.com/o/spaces%2FwMLlMoFBtKJa8ptd3zaw%2Fuploads%2Fgit-blob-55f9a4ba17f1edde22510bc766728b311864c461%2Feaf620c7b74ff071d06c5e1b12bb1bd184361280cdc0ea896c3f8058c11b8532.svg?alt=media) **\[Columns]** icon at the top-right of the report.

  <div data-with-frame="true"><figure><img src="https://4048883401-files.gitbook.io/~/files/v0/b/gitbook-x-prod.appspot.com/o/spaces%2FwMLlMoFBtKJa8ptd3zaw%2Fuploads%2Fgit-blob-cba9a3e9248537b7fefe5a294bfc83d28ead4df8%2F4d53916bd7b265f4b89668e1e92b686bd50aec0d1d240f9a59f95c6c39930d3a.png?alt=media" alt=""><figcaption></figcaption></figure></div>

{% endtab %}

{% tab title="Comparison graph" %}
The comparison graph compares the *ads* of selected rows in the data table based on the metric selected in the trend graph. This graph will show a daily trend of the selected ads over the selected date range.

1. Select the specific metric from the ![](https://4048883401-files.gitbook.io/~/files/v0/b/gitbook-x-prod.appspot.com/o/spaces%2FwMLlMoFBtKJa8ptd3zaw%2Fuploads%2Fgit-blob-c2cb550b55c51ea1eeff0acbd6f437a03b621a2c%2F60d033ae8a04c14498d5229c3c0160ac05feea7f605dbd770741793c900469f0.svg?alt=media) **\[Drop-down menu]** in the trend graph.
2. Select the empty checkbox next to the row in the data table for the metrics you want to compare.
   * Each selected checkbox will be displayed in a specific color that will reflect in the trend graph.
3. Select **Graph rows** to compare the selected rows.
4. Select **Clear compare** to clear the trend view.

   <div data-with-frame="true"><figure><img src="https://4048883401-files.gitbook.io/~/files/v0/b/gitbook-x-prod.appspot.com/o/spaces%2FwMLlMoFBtKJa8ptd3zaw%2Fuploads%2Fgit-blob-8bb96633b1cf5b12a89a2c9255e92eb68bb7281e%2F63573f9fd8b50dd94f8f0e59439edb086d989bed5ffd5ce4e11eeb3c15956945.png?alt=media" alt=""><figcaption></figcaption></figure></div>

{% endtab %}
{% endtabs %}

<details>

<summary>Filter reference</summary>

| Filter     | Description                                                                                                                                                                                                                                                                                                                                                                                                                                                                                                                                                                                                    |
| ---------- | -------------------------------------------------------------------------------------------------------------------------------------------------------------------------------------------------------------------------------------------------------------------------------------------------------------------------------------------------------------------------------------------------------------------------------------------------------------------------------------------------------------------------------------------------------------------------------------------------------------- |
| Date Range | <p>
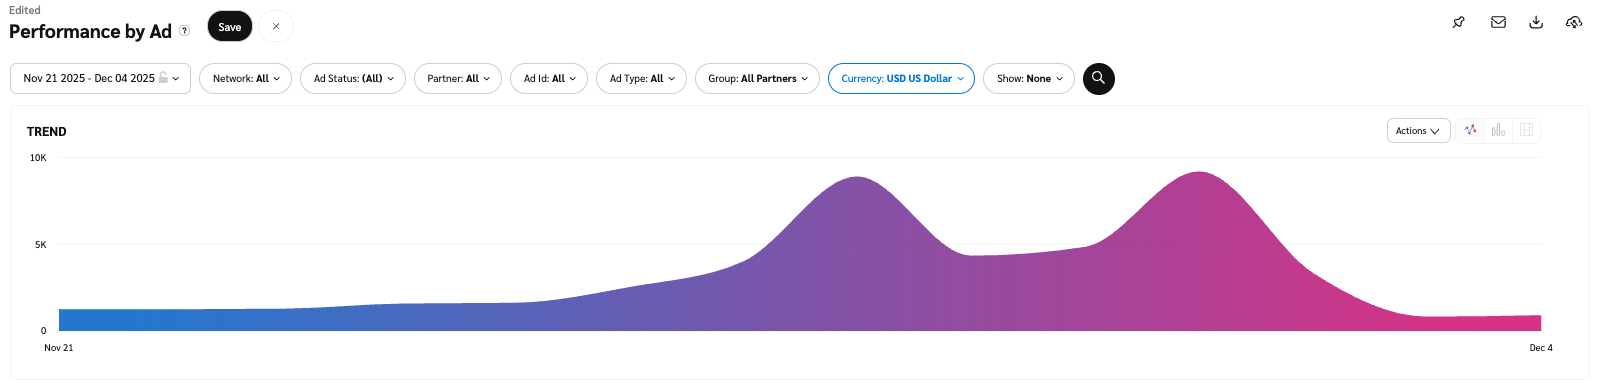
Filter data by when it was created. You can also compare two periods of time against each other.</p><p>You can pull a maximum of <strong>366 days</strong> of data. However, you can still perform Year-over-Year reporting by selecting <img src="https://paligoapp-cdn-eu1.s3.eu-west-1.amazonaws.com/impact/attachments/f01cdffa431a4d75ff09c130b66974d4-396370c2cdec89ba7d714c4c58e6845b.svg" alt="[Unchecked box]"> <strong>\[Unchecked box]</strong> <strong>compare to {Previous year}</strong>.</p><p>If you want to pull more than 366 days of data, you will need to create multiple reports.</p> |
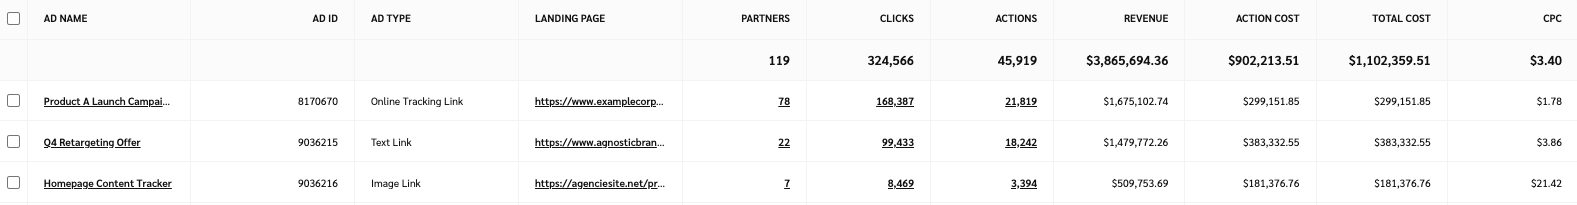
| Network    | Filter by data source.                                                                                                                                                                                                                                                                                                                                                                                                                                                                                                                                                                                         |
| Ad Status  | Choose if you want to view active, expired, or pending ads, or a combination of all three.                                                                                                                                                                                                                                                                                                                                                                                                                                                                                                                     |
| Partner    | Select which partners for which you want to view data.                                                                                                                                                                                                                                                                                                                                                                                                                                                                                                                                                         |
| Ad Id      | Enter the Ad Id for which you want to view data.                                                                                                                                                                                                                                                                                                                                                                                                                                                                                                                                                               |
| Ad Type    | Filter data by one or all of the [types of ads](https://help.impact.com/brand/what-would-you-like-to-learn-about/platform-features/ads/create-ads/introduction-to-asset-types).                                                                                                                                                                                                                                                                                                                                                                                                                                |
| Group      | Filter data by [partner groups](https://help.impact.com/brand/what-would-you-like-to-learn-about/platform-features/reach-out-to-partners/partner-groups/create-and-manage-partner-groups).                                                                                                                                                                                                                                                                                                                                                                                                                     |
| Currency   | Set the currency in which you want to view report data. impact.com will convert the amounts to your selected currency.                                                                                                                                                                                                                                                                                                                                                                                                                                                                                         |

**Show:** Add data from a large selection of choices. These data points will get added to the table report under the graph after you select ![\[Search\] vNext](https://paligoapp-cdn-eu1.s3.eu-west-1.amazonaws.com/impact/attachments/f01cdffa431a4d75ff09c130b66974d4-378d7abd37e544e2e1a120594a46cf7a.svg) **\[Search]**.

| Data point                              | Description                                                                                                                                                                                                                                                                                                                                                                              |
| --------------------------------------- | ---------------------------------------------------------------------------------------------------------------------------------------------------------------------------------------------------------------------------------------------------------------------------------------------------------------------------------------------------------------------------------------- |
| Payable Clicks                          | <p>The number of unique clicks tracked, including clicks processed via <a href="https://help.impact.com/en/support/solutions/articles/155000001383-cpc-v2-faqs">CPCv2</a>.</p><p>Select the amount under Payable Clicks (CPCv2) to access the <a href="https://help.impact.com/en/support/solutions/articles/155000002444-payable-click-data-report">Payable Clicks Data report</a>.</p> |
| Ad Version                              | The number of ad revisions since uploading the ad.                                                                                                                                                                                                                                                                                                                                       |
| Actions - Event Type                    | The number of conversions generated for this event type.                                                                                                                                                                                                                                                                                                                                 |
| Action Cost - Event Type                | The total cost associated with driving the conversions for this event type.                                                                                                                                                                                                                                                                                                              |
| Gross Actions                           | The total number of actions (including **Reversed Actions**).                                                                                                                                                                                                                                                                                                                            |
| Gross Actions - Event Type              | The total number of actions (including **Reversed Actions**) by event type.                                                                                                                                                                                                                                                                                                              |
| Gross Action Cost                       | The total cost of **Locked** and **Open-Ended Actions** plus **Reversed Action Cost**.                                                                                                                                                                                                                                                                                                   |
| Gross Action Costs - Event Type         | The total cost of **Locked** and **Open-Ended Actions** plus **Reversed Action Cost** by event type.                                                                                                                                                                                                                                                                                     |
| Network                                 | A [third-party network](https://help.impact.com/brand/what-would-you-like-to-learn-about/platform-features/cross-channel-performance-insights/configure-affiliate-networks-for-deduplication) that won actions during the period specified for this report.                                                                                                                              |
| Cost per Action (CPA)                   | Total **Cost of Actions** divided by number of actions.                                                                                                                                                                                                                                                                                                                                  |
| Cost per Action (CPA) - Event Type      | Total **Cost of Actions** divided by number of actions by event type.                                                                                                                                                                                                                                                                                                                    |
| Imported Cost                           | The **Cost of Actions** imported from third-party tracking systems.                                                                                                                                                                                                                                                                                                                      |
| Click Through Rate                      | The number of **Clicks** divided by the total number of **Impressions**.                                                                                                                                                                                                                                                                                                                 |
| Conversion Rate                         | The number of actions divided by the total number of clicks across your programe.                                                                                                                                                                                                                                                                                                        |
| Conversion Rate - Event Type            | The number of actions divided by the total number of clicks for this event type.                                                                                                                                                                                                                                                                                                         |
| Return on Ad Spend (ROAS)               | This number represents **Revenue** divided by **Total Cost**.                                                                                                                                                                                                                                                                                                                            |
| Return on Ad Spend (ROAS) - Event Type  | This number represents **Revenue** divided by **Total Cost** by event type.                                                                                                                                                                                                                                                                                                              |
| Return on Investment (ROI)              | This number represents **Revenue** divided by **Total Business Cost**.                                                                                                                                                                                                                                                                                                                   |
| Return on Investment (ROI) - Event Type | This number represents **Revenue** divided by **Total Business Cost** by event type.                                                                                                                                                                                                                                                                                                     |
| Average Order Value (AOV)               | The total revenue of sale actions divided by the number of sale actions.                                                                                                                                                                                                                                                                                                                 |
| Average Order Value (AOV) - Event Type  | The total revenue of sale actions divided by the number of sale actions by event type.                                                                                                                                                                                                                                                                                                   |
| Margin                                  | This number represents **Revenue** minus **Goods Cost**.                                                                                                                                                                                                                                                                                                                                 |
| Margin - Event Type                     | This number represents **Revenue** minus **Goods Cost** by event type.                                                                                                                                                                                                                                                                                                                   |
| Total Business Cost                     | The total **Cost of Goods** plus **Total Cost**.                                                                                                                                                                                                                                                                                                                                         |
| Total Business Cost - Event Type        | The total **Cost of Goods** plus **Total Cost** by event type.                                                                                                                                                                                                                                                                                                                           |
| Discount                                | The discounted amount captured at conversion.                                                                                                                                                                                                                                                                                                                                            |
| Client Cost                             | **Client Cost** charged by an Agency plus **Total Cost**.                                                                                                                                                                                                                                                                                                                                |
| Discount Rate                           | The percentage discount calculated as **Discount** divided by **Revenue**.                                                                                                                                                                                                                                                                                                               |
| Discount Rate - Event Type              | The percentage discount calculated as **Discount** divided by **Revenue** by event type.                                                                                                                                                                                                                                                                                                 |
| Item Count                              | The number of products in the basket captured at conversion.                                                                                                                                                                                                                                                                                                                             |
| Goods Cost                              | The total cost of products in the basket captured at conversion.                                                                                                                                                                                                                                                                                                                         |
| Goods Cost - Event Type                 | The total cost of products in the basket captured at conversion by event type.                                                                                                                                                                                                                                                                                                           |
| Revenue - Event Type                    | The total revenue per by event type.                                                                                                                                                                                                                                                                                                                                                     |
| Reversed Revenue                        | The total revenue of **Reversed Actions**.                                                                                                                                                                                                                                                                                                                                               |
| Reversed Revenue - Event Type           | The total revenue of **Reversed Actions** by event type.                                                                                                                                                                                                                                                                                                                                 |
| Reversed Actions                        | The number of conversions that have been [reversed](https://help.impact.com/brand/what-would-you-like-to-learn-about/platform-features/actions-and-payouts/payouts/approve-reverse-and-modify-pending-payouts-for-actions) across your program.                                                                                                                                          |
| Reversed Actions - Event Type           | The number of conversions that have been [reversed](https://help.impact.com/brand/what-would-you-like-to-learn-about/platform-features/actions-and-payouts/payouts/approve-reverse-and-modify-pending-payouts-for-actions) by event type.                                                                                                                                                |
| Reversed Action Cost                    | The total **Action Cost** of **Reversed Actions**.                                                                                                                                                                                                                                                                                                                                       |
| Reversed Action Cost - Event Type       | The total **Action Cost** of **Reversed Actions** by event type.                                                                                                                                                                                                                                                                                                                         |
| Reversal Rate                           | The number of reversals divided by the number of **Total Actions**.                                                                                                                                                                                                                                                                                                                      |
| Reversal Rate - Event Type              | The number of reversals divided by the number of **Total Actions** by event type.                                                                                                                                                                                                                                                                                                        |
| Raw Impressions                         | The total number of times the ad was displayed on a user's screen.                                                                                                                                                                                                                                                                                                                       |
| Raw Clicks                              | The total number of clicks tracked.                                                                                                                                                                                                                                                                                                                                                      |
| Open-Ended Actions                      | The total number of [*pending*](https://help.impact.com/brand/what-would-you-like-to-learn-about/platform-features/actions-and-payouts/understand-the-action-life-cycle-and-finance) actions.                                                                                                                                                                                            |
| Open-Ended Actions - Event Type         | The total number of *pending* actions by event type.                                                                                                                                                                                                                                                                                                                                     |
| Confirmed Actions                       | The total number of [*approved*](https://help.impact.com/brand/what-would-you-like-to-learn-about/platform-features/actions-and-payouts/understand-the-action-life-cycle-and-finance) actions.                                                                                                                                                                                           |
| Confirmed Actions - Event Type          | The total number of *approved* actions by event type.                                                                                                                                                                                                                                                                                                                                    |
| Gross Revenue                           | The total *processing* and *locked* **Revenue** plus **Reversed Revenue**.                                                                                                                                                                                                                                                                                                               |
| Gross Revenue - Event Type              | The total *processing* and *locked* **Revenue** plus **Reversed Revenue** by event type.                                                                                                                                                                                                                                                                                                 |
| Answered Calls                          | The number of tracked phone calls with a `CallStatus` of `ANSWERED`.                                                                                                                                                                                                                                                                                                                     |

</details>

<details>

<summary>Report data column reference</summary>

| Column       | Description                                                                                                                                                                                           |
| ------------ | ----------------------------------------------------------------------------------------------------------------------------------------------------------------------------------------------------- |
| Ad Name      | The name of the ad on which the data is based.                                                                                                                                                        |
| Ad ID        | The unique identifier of the ad on which the data is based.                                                                                                                                           |
| Ad Type      | The [category of ad](https://help.impact.com/brand/what-would-you-like-to-learn-about/platform-features/ads/create-ads/introduction-to-asset-types) (E.g., Banner, Online Tracking Link, Promo Code). |
| Landing Page | The URL to which the ad directs.                                                                                                                                                                      |
| Partners     | The total number of partners running this ad.                                                                                                                                                         |
| Impressions  | The number of audience members that viewed content.                                                                                                                                                   |
| Clicks       | The total number of link clicks that took the partners' audience from the ad to your landing page.                                                                                                    |
| Actions      | The total number of conversions (sales, app installs, etc.) tracked for a particular ad. This number excludes any reversed conversions.                                                               |
| Revenue      | This is the total amount of sales partners have generated for you from conversions for a particular ad.                                                                                               |
| Action Cost  | The amount of compensation paid to partners associated with a specific ad for driving the traffic that resulted in conversions.                                                                       |
| Click Cost   | The aggregated value of the amount due to partners for driving clicks.                                                                                                                                |
| Other Cost   | Additional costs associated with performance bonuses, make-good payments, and placement fees.                                                                                                         |
| Total Cost   | The total amount paid out for this ad over the selected period, i.e., the sum of your *Action Cost*, *Click Cost*, and *Other Cost*.                                                                  |
| CPC          | The Cost Per Click. The total cost divided by the total number of clicks.                                                                                                                             |
| Start Date   | The day this ad started being used.                                                                                                                                                                   |
| End Date     | The expiration date for this ad.                                                                                                                                                                      |

</details>
