For the complete documentation index, see llms.txt. This page is also available as Markdown.

Overview by Media Property Report

Upgrade: This feature is available for free with Trackonomics Essentials. To access it, along with a suite of additional tools to grow your program, activate Trackonomics Essentials today.

Use this report to see which platforms perform best and where your revenue and conversions come from, so you can invest more in your top channels.

  1. In the top navigation menu, select Trackonomics.

  2. From the [Drop-down menu], select Overview by Media Property.

You can set the currency in the top right if your program works with multiple currencies. You can also select [Download] to download your report in PDF or CSV format or [Email] to send the report via email. Filter by date range to view data over a specific time frame.

Report data segments

This feature is only available with the Trackonomics add-on. Contact support for further information.

The data in this report is organized into the following sections:

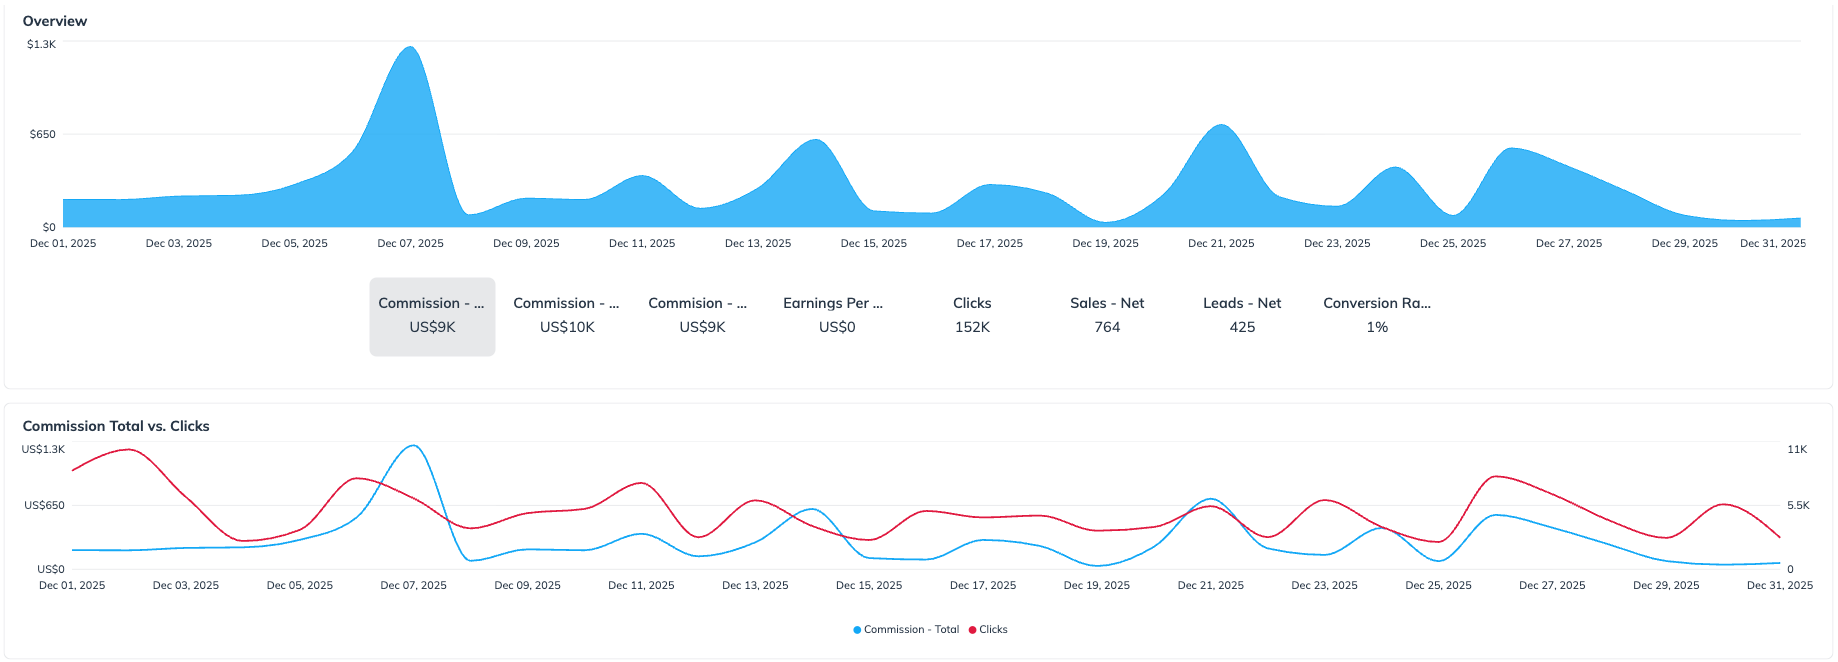
This section features two distinct graphs and an interactive metric display.

  1. Primary Trend Graph: This area chart displays the trend of a single metric over your selected date range. The metric shown is controlled by the Metric Selector Buttons located directly beneath the graph.

  2. Metric Selector Buttons: These buttons (e.g., Commission - Net, Clicks, Sales - Net) allow you to quickly change the data displayed in the Primary Trend Graph above, providing an immediate overview of that metric's performance.

  3. Commission Total vs. Clicks Graph: This secondary line graph provides a comparative trend analysis between two key performance indicators: Commission - Total and Clicks. This graph is static and not affected by the Metric Selector Buttons.

To download this graphed data, select [Download] in the top right corner.

This set of data is presented in the form of a table. It shows which social channels are driving the most revenue or conversions. This table of data can be downloaded by selecting [Download] in the top right corner. These data points include:

Data point reference table
Data Point
Description

Media Property

This column shows the specific platform, channel, or digital asset used to promote an advertiser’s brand. It identifies where the traffic, clicks, and conversions originated.

Commission - Total

The total commission amount attributed to you across all actions (sales, leads, installs, etc.), before any deductions or validation. This total includes all conversions regardless of approval status (e.g., pending, approved, reversed).

Commission - Gross

The total commission amount for all valid actions (approved conversions only), before any deductions like adjustments or partner fees. This amount reflects what you would earn if no reversals or clawbacks occurred.

Commission - Net

The final commission you are owed after action validations (e.g., canceled orders), reversals (e.g., returns or fraud), adjustments and partner or platform fees. This amount is what is actually paid out to you.

Sales - Net

The number of validated sales (e.g., product purchases) that were approved and not canceled or refunded. Use this metric to measure performance quality and conversion.

Leads - Net

The number of valid leads generated (e.g., form completions, trial sign-ups) after removing duplicates, spam, or invalid entries. This metric reflects actual, qualified lead volume.

Clicks

The number of click-throughs (referrals) generated from your affiliate links tracked via impact.com. Clicks can include unique and repeat clicks, and are useful for measuring traffic volume and link engagement.

Impressions

The total number of views that help measure the reach and visibility of your promotional efforts for a specific advertiser.

Earnings Per Click (EPC)

EPC shows how much you're earning per click driven through your tracking links. Measured over time, this helps compare performance across campaigns or content.

Conversion Rate (CR)

The percentage of clicks that led to a successful, valid conversion (sale or lead). A key metric to gauge how well your traffic is converting into actions.

Last updated

Was this helpful?