| Advertiser Name | The name of the advertiser you are partnered with through impact.com. |
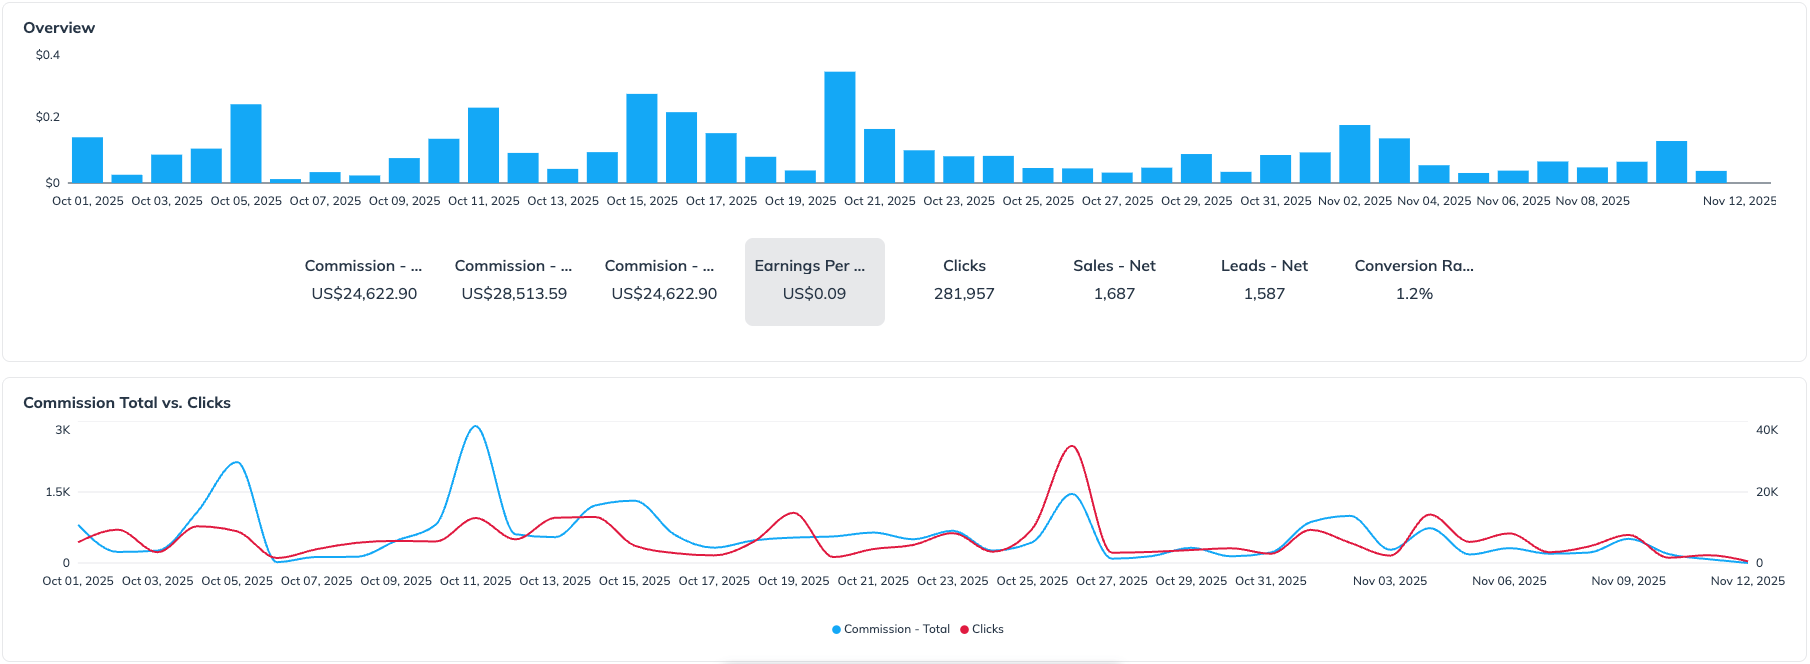
| Commission - Total | The total commission amount attributed to you across all actions (sales, leads, installs, etc.), before any deductions or validation. This total includes all conversions regardless of approval status (e.g., pending, approved, reversed). |
| Commission - Gross | The total commission amount for all valid actions (approved conversions only), before any deductions like adjustments or partner fees. This amount reflects what you would earn if no reversals or clawbacks occurred. |
| Commission - Net | The final commission you are owed after action validations (e.g., canceled orders), reversals (e.g., returns or fraud), adjustments and partner or platform fees. This amount is what is actually paid out to you. |
| Sales - Net | The number of validated sales (e.g., product purchases) that were approved and not canceled or refunded. This metric can be used to measure performance quality and conversion. |
| Leads - Net | The number of valid leads generated (e.g., form completions, trial sign-ups) after removing duplicates, spam, or invalid entries. This metric reflects actual, qualified lead volume. |
| Clicks | The number of click-throughs (referrals) generated from your affiliate links tracked via impact.com. Clicks can include unique and repeat clicks, and are useful for measuring traffic volume and link engagement. |
| Impressions | The total number of views that help measure the reach and visibility of your promotional efforts for a specific advertiser. |
| Earnings Per Click (EPC) | EPC shows how much you're earning per click driven through your tracking links. Measured over time, this helps compare performance across campaigns or content. |
| Conversion Rate (CR) | The percentage of clicks that led to a successful, valid conversion (sale or lead). A key metric to gauge how well your traffic is converting into actions. |