# Performance by Day for Partners

The *Performance by Day* report for partners shows you a wide range of tracking data broken down by day. KPIs, like actions, clicks, and more, can all be found here.

#### Manage the report

1. From the top navigation bar, select **Reports** → **More Reports**.
2. From the *Category* filter next to the search bar, select **Performance**.
3. Select [Performance by Day](https://app.impact.com/secure/mediapartner/report/viewReport.report?handle=partner_performance_by_day).

   * You can also pin the report to the top navigation bar by hovering over the row and selecting **Pin**.

   <div data-with-frame="true"><figure><img src="/files/IMvrXO6r1x69DQ5TKC9z" alt="" width="563"><figcaption></figcaption></figure></div>
4. Below the report title, filter for the data you want to view. Select ![](/files/UtRJFdjmzq4JXmuHsnuw) **\[Search]** when you have the filters in place that you want.
   * View the *Filter reference* table below for more information.
   * You can use the icons at the top-right of the page to ![](/files/4DhvTEg0qAwkiMd4XGcl) [**\[Schedule\]**](/partner/what-would-you-like-to-learn-about/platform-features/reporting-for-partners/report-management/schedule-a-report-as-a-partner.md), ![](/files/oYpmMHTKlbCVz5e1NE8b) **\[Download]** in PDF, Excel, or CSV format, or ![](/files/L2yKMHZgpbcqYQHc6i6S) [**\[Export\]**](https://integrations.impact.com/impact-publisher/reference/export-reports) the report via API.

#### Access the report data

You can view the report data as a trend graph or table and compare certain metrics.

{% tabs %}
{% tab title="Trend graph" %}
The trend graph enables you to filter your report according to the core group of metrics that drives the highest value. This view provides the selected metric’s daily trends over a specific date range.

1. Select the ![](/files/8sWL7hpIpupIhTbAluAU) \[Drop-down menu] in the upper-right corner, then, choose a specific metric.
2. Alternate between the line, bar, and treemap views by selecting the view icon.

   <div data-with-frame="true"><figure><img src="/files/IMvrXO6r1x69DQ5TKC9z" alt="" width="563"><figcaption></figcaption></figure></div>

{% endtab %}

{% tab title="Data table" %}
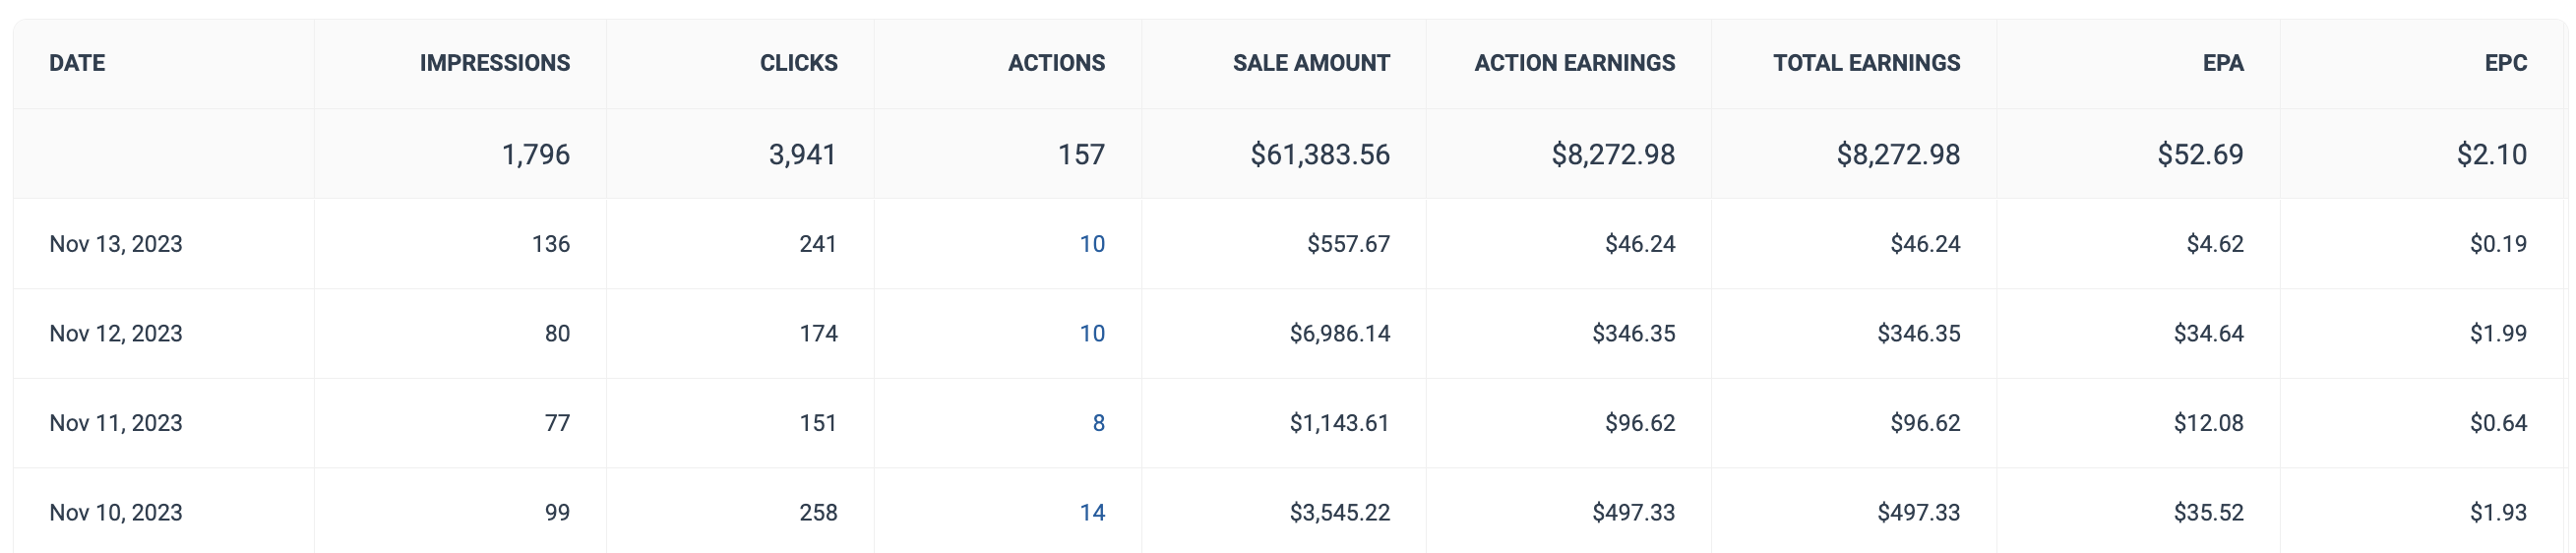
Below the trend graph is the data table. The data table provides different data points displayed in a column view. This view provides a detailed set of comparable numbers over the selected date range.

* Refer to the *Report data column reference* below for more information on the columns found in the data table.
* Add or remove columns from the report table using the ![](/files/gGYYWLIromSdxqAltdfW) **\[Columns]** icon at the top-right of the report.

<div data-with-frame="true"><figure><img src="/files/scavyKSiR66xgAhCJx2B" alt=""><figcaption></figcaption></figure></div>
{% endtab %}
{% endtabs %}

<details>

<summary>Filter reference</summary>

| Filter     | Description                                                                                                                                                                                                                                                                                                   |
| ---------- | ------------------------------------------------------------------------------------------------------------------------------------------------------------------------------------------------------------------------------------------------------------------------------------------------------------- |
| Date Range | You can pull a maximum of **366 days** of data.                                                                                                                                                                                                                                                               |
| Program    | Select the specific program(s) for which you want to view performance data.                                                                                                                                                                                                                                   |
| Currency   | Set the currency in which you want to view report data. impact.com will convert the amounts to your selected currency.                                                                                                                                                                                        |
| Show       | Add data from a large selection of choices. These data points will get added to the table report under the graph after you select ![\[Search\]](https://paligoapp-cdn-eu1.s3.eu-west-1.amazonaws.com/impact/attachments/f01cdffa431a4d75ff09c130b66974d4-d9034475259004cc4d724957e37096f4.svg) **\[Search]**. |

#### Data points explained

| Data point                  | Description                                                                                                                                                                                                                                                                                                                                    |
| --------------------------- | ---------------------------------------------------------------------------------------------------------------------------------------------------------------------------------------------------------------------------------------------------------------------------------------------------------------------------------------------- |
| Sortable Date               | Add this column to your report and you will be able to sort the column from earliest to latest date and vice versa.                                                                                                                                                                                                                            |
| Sales Metrics               | This includes your Sale CR (Sale conversion rate—the number of sales divided by the number of clicks), Sale EPA (Earnings per sale action—Sale earnings divided by the number of sale actions), and Sale EPC (Earnings per unique click—Sale earnings divided by the number of unique clicks) metrics.                                         |
| Lead Metrics                | This includes your Lead CR (Lead conversion rate—the number of leads divided by the number of clicks), Lead EPA (Earnings per lead action—Earnings associated with lead actions divided by the number of lead actions), and Lead EPC (Earnings per unique click—Earnings associated with lead actions divided by the number of unique clicks). |
| Call Metrics                | This includes the Calls (The number of tracked calls), Converted Calls (The number of call actions—pay-per-ring, pay-per-duration, and pay-per-call conversions, excluding reversed actions), and Call Earnings (Earnings associated with converted call actions) metrics.                                                                     |
| Mobile Install Metrics      | This includes the number of mobile install actions and the earnings associated with those actions.                                                                                                                                                                                                                                             |
| Other Mobile Action Metrics | This includes the number of mobile-related (non-install) actions and the earnings associated with those actions.                                                                                                                                                                                                                               |
| Reversals                   | This metric shows the number of reversals per program in the chosen period.                                                                                                                                                                                                                                                                    |
| CTR Metrics                 | This metric shows you your click-through rate per program during the chosen period.                                                                                                                                                                                                                                                            |

</details>

<details>

<summary>Report data column reference</summary>

| Column          | Description                                                                                                                                                                                                                                        |
| --------------- | -------------------------------------------------------------------------------------------------------------------------------------------------------------------------------------------------------------------------------------------------- |
| Date            | All data for this particular row was generated on this date.                                                                                                                                                                                       |
| Impressions     | The number of audience members that viewed content that day.                                                                                                                                                                                       |
| Clicks          | The total number of link clicks that took your audience to the brand's landing page on this date.                                                                                                                                                  |
| Actions         | <p>The total number of conversions (sales, app installs, etc.) tracked for a particular day. This number excludes any reversed conversions.</p><p>Select the <strong>number of actions</strong> to view an action listing for this row's date.</p> |
| Sale Amount     | This is the total amount of revenue you generated for the brand on this day.                                                                                                                                                                       |
| Action Earnings | The amount of compensation paid to you for driving the traffic that resulted in conversions on this date.                                                                                                                                          |
| Click Cost      | The aggregated value of the amount due to you for driving clicks.                                                                                                                                                                                  |
| Total Earnings  | See total compensation earned for traffic driven on this data. This is the total compensation you received from the brand for this day. (e.g., *Action Earnings* + *Click Cost* earnings + performance bonus).                                     |
| EPA             | This metric shows you your earnings per conversion (sales, app installs, etc.) on this day.                                                                                                                                                        |
| EPC             | See your total earnings per link click (EPC) per day.                                                                                                                                                                                              |
| Conversion Rate | The number of actions divided by the total number of clicks across your program on this day.                                                                                                                                                       |
| AOV             | <p>The average order value associated with this day.</p><p>AOV=<em>Sale Amount</em> divided by <em>Actions</em>.</p>                                                                                                                               |

</details>


---

# Agent Instructions: Querying This Documentation

If you need additional information that is not directly available in this page, you can query the documentation dynamically by asking a question.

Perform an HTTP GET request on the current page URL with the `ask` query parameter:

```
GET https://help.impact.com/partner/what-would-you-like-to-learn-about/platform-features/reporting-for-partners/performance-reports-for-partners/performance-by-day-for-partners.md?ask=<question>
```

The question should be specific, self-contained, and written in natural language.
The response will contain a direct answer to the question and relevant excerpts and sources from the documentation.

Use this mechanism when the answer is not explicitly present in the current page, you need clarification or additional context, or you want to retrieve related documentation sections.