> For the complete documentation index, see [llms.txt](https://help.impact.com/llms.txt). Markdown versions of documentation pages are available by appending `.md` to page URLs; this page is available as [Markdown](https://help.impact.com/brand/zh/what-would-you-like-to-learn-about/platform-features/multi-program-reports/data-lab-custom-reports/edit-a-custom-report.md).
# 编辑自定义报告
1. 从左侧导航菜单中,选择  **\[Engage]** → **报告 → 更多报告**.
2. 选择 **类别** 以及筛选 **已构建**  **\[未选中复选框]**.
3. 将鼠标悬停在要编辑的报告上,然后选择 **查看**.
4. 选择要编辑的可视化,然后更改 *维度、度量*以及所需的筛选条件。
5. 在右上角,选择 **保存**.
#### 管理您的可视化
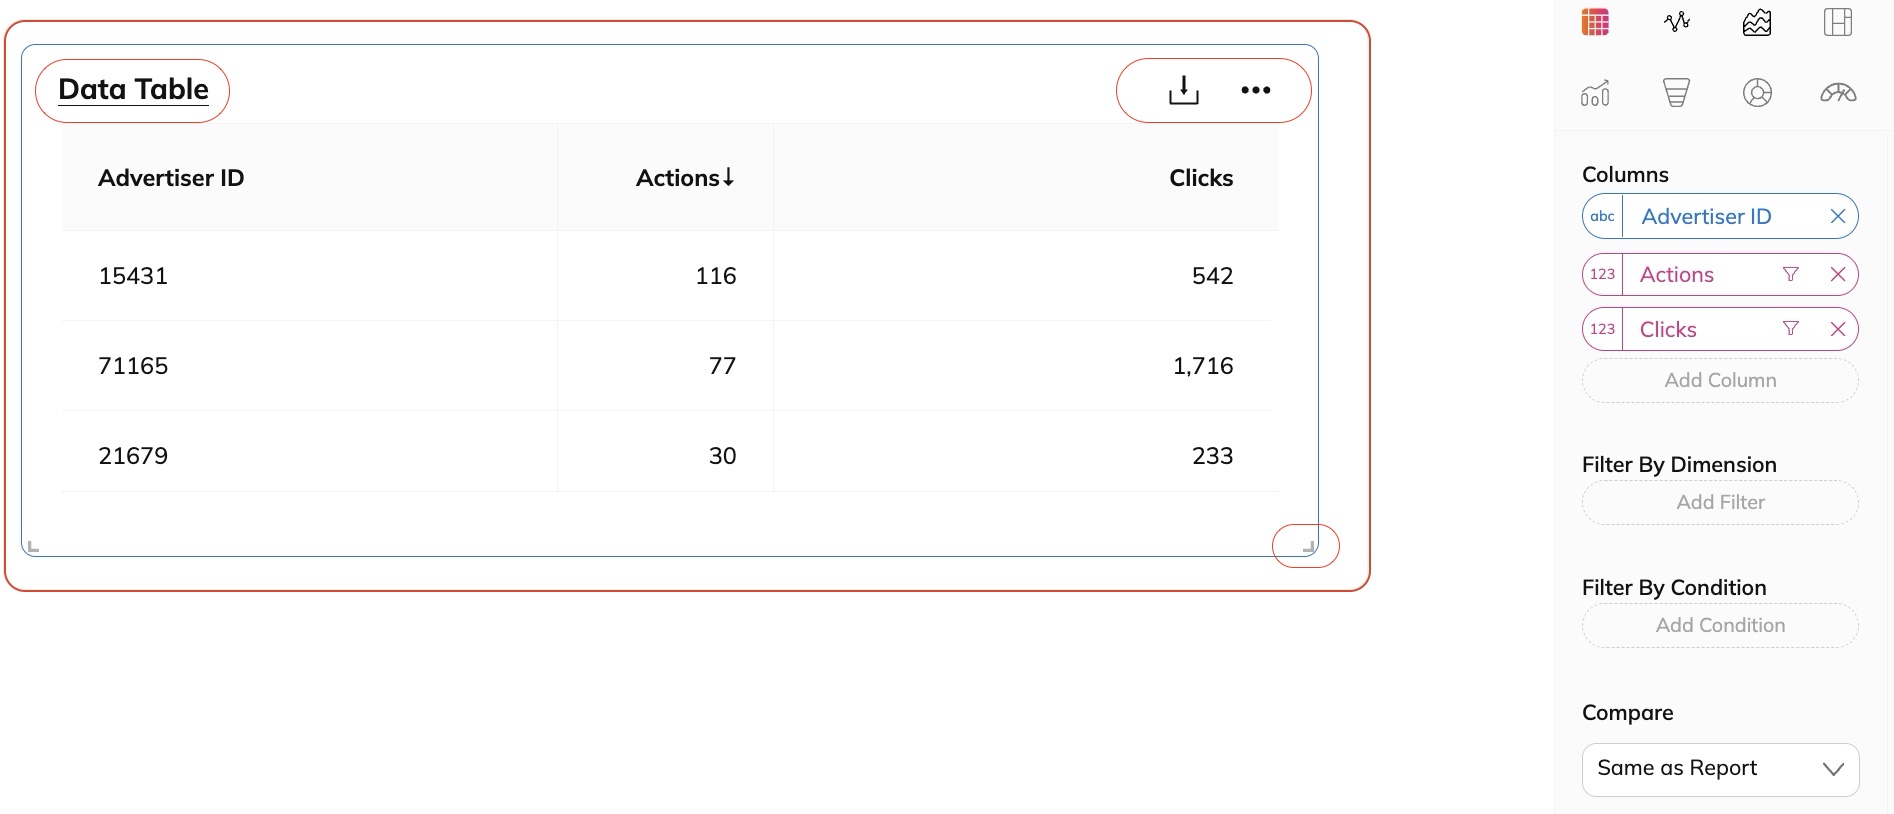
您可以自定义已添加的每个可视化的名称、调整大小、下载、克隆和删除。
* **为数据可视化命名**:
选择 *未命名* 右上角的字段,并为可视化命名。在上面的示例中,我们添加了一个数据表,并相应地为其命名。
* **调整数据可视化的大小**:
将光标悬停在左下角或右下角的角括号上,然后拖动到所需大小。
* **下载数据可视化**:
选择  **\[下载]** 并选择要将数据保存为 PDF 还是 CSV 格式。
* **克隆数据可视化**:
选择  **\[菜单] → 克隆**。这将创建相同可视化的副本。然后您可以更改或修改数据字段,从而拥有两组数据表,但数据不同。这可能是帮助对数据集进行分类或组织的好方法。
* **删除数据可视化**:
选择  **\[菜单] → 删除**。这可用于移除您不再希望在报告中显示的数据可视化。
---
# Agent Instructions
This documentation is published with GitBook. GitBook is the documentation platform designed so that both humans and AI agents can read, navigate, and reason over technical content effectively. Learn more at gitbook.com.
## Querying This Documentation
If you need additional information that is not directly available in this page, you can query the documentation by asking a question.
Perform an HTTP GET request on the following URL with the `ask` and `goal` query parameters:
```
GET https://help.impact.com/brand/zh/what-would-you-like-to-learn-about/platform-features/multi-program-reports/data-lab-custom-reports/edit-a-custom-report.md?ask=&goal=
```
`ask` is the immediate question: it should be specific, self-contained, and written in natural language.
`goal` is what the user is ultimately trying to achieve, the reason they need the answer. Sharing it helps GitBook give you a better, more relevant answer. A goal is most helpful when it describes the outcome the user wants rather than restating the question. For example, with `ask=how do I create an API token`, a goal like `automate deployments from our CI pipeline` lets GitBook tailor the answer to that use case.
The response will contain a direct answer to the question and relevant excerpts and sources from the documentation.
Use this mechanism when the answer is not explicitly present in the current page, you need clarification or additional context, or you want to retrieve related documentation sections.